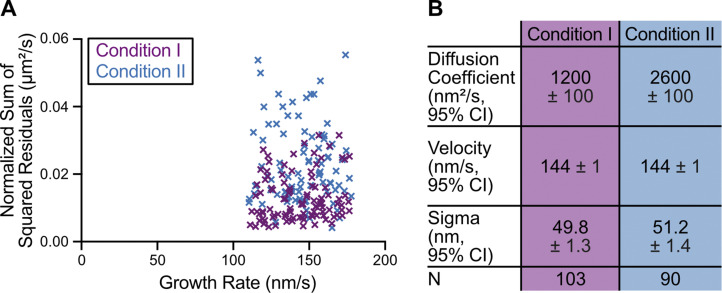
Figure S3.
Residual and MSD analyses indicate higher fluctuations in microtubule growth rate in the presence of XMAP215. (A) Growth events used for SSR analysis in Fig. 3 A were selected to have no significant difference in growth rate: condition I (60 µM tubulin and 200 nM EB1-GFP), 143 ± 18 nm/s (mean ± SD, n = 103); condition II (20 µM tubulin, 200 nM EB1-GFP, and 12.5/25 nM XMAP215), 145 ± 18 nm/s (n = 90). P = 0.54, t test. (B) MSD analysis was used to determine the diffusion coefficient (D), velocity (v), and positional error (σ) of microtubule growth by fitting a quadratic function, MSD(t) = 2Dt2 + v2t2 + σ2 (Gardner et al., 2011a).

