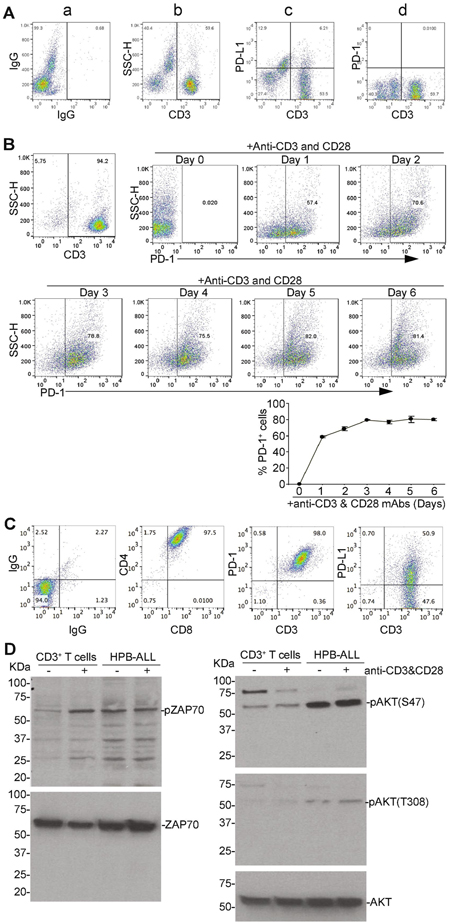
Figure 1. The TCR signaling pathway is hyperactive in the PD-1+PD-L1+ human T lymphoma cells in vitro.
A. Human peripheral blood mononuclear cells (PBMC) were stained with IgG siotype control, and CD3−, PD-L1−, and PD-1-specific antibodies and analyzed by flow cytometry. Shown are representative plots of IgG (a), CD3+ T cells (b), CD3+ PD-L1+ (c), and CD3+ PD-1+ (d) cells. B. CD3+ T cells were purified from human PBMC as shown in A (top left panel) and stimulated with anti-CD3 and CD28 antibodies. Cells were collected at the indicated time points and stained with PD-1-specific antibodies. PD-1+ cells were quantified by analysis with flow cytometry. Shown are representative dot plots of PD-1 expression in purified CD3+ T cells (top right and middle panels). The PD-1+ cells were quantified and prewnted at the bottom panel. Shown are one representative experiments of three independent experiments. C. Human T lymphoma cell line HPB-ALL were stained with either IgG or CD4−, CD8−, CD3−, PD-1, and PD-L1-specific antibodies and analyzed by flow cytometry. Shown are representative plots of the phenotypes. D. Purified human CD3+ T cells and HPB-ALL cells were stimulated with anti-CD3 and anti-CD28 antibodies and analyzed by Western blotting for antibodies that are specific for phosphorylated ZAP70 (pZAP70) and AKTs [pAKT(S473), pAKT(T308)]. Total ZAP70 and AKT are used as normalization control.

