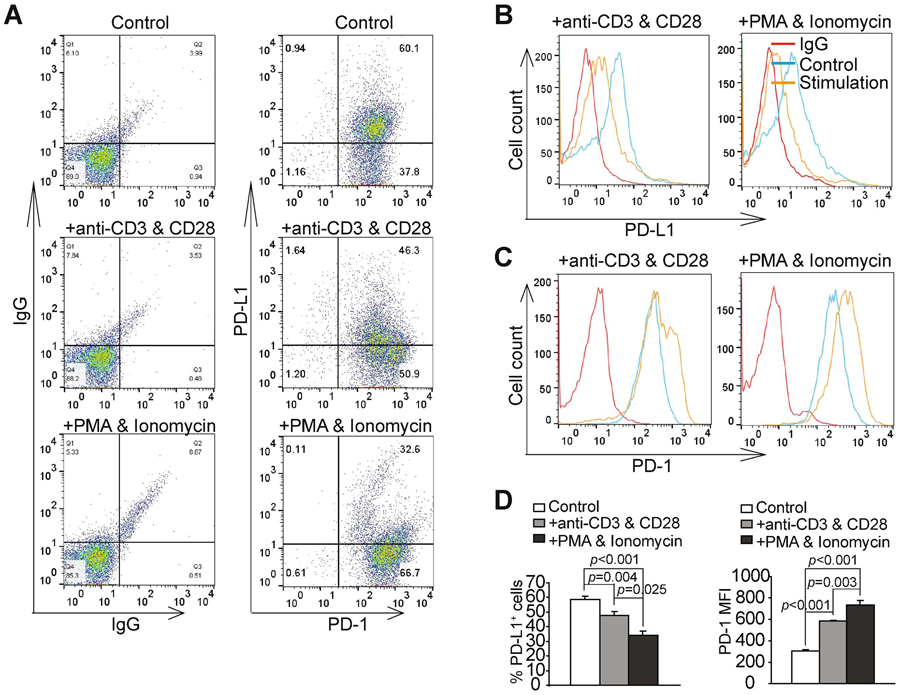
Figure 3. The T cell receptor signaling pathway negatively regulates PD-L1 expression in human T lymphoma.
A. HPB-ALL cells were stimulated with IgG (control), anti-CD3 and anti-CD28, or PMA and ionomycin for three days. Cells were then stained IgG (as negative staining controls), PD-1− and PD-L1-specific antibodies, and analyzed by flow cytometry. Shown are representative plots of IgG, PD-1 and PD-L1 staining. B. PD-L1 MFIs of control and stimulated cells were determined. Shown are representative images of overlay of PD-L1 MFIs of the three cell groups. C. PD-1 MFIs of control and stimulated cells were determined. Shown are representative images of overlay of PD-L1 MFIs of the three cell groups. D. Quantification of PD-L1+ and PD-1+ cells of the three treatment groups. The percentages of PD-L1+ and PD-1+ cells in the control and stimulated cells (n=3) were quantified and analyzed by student t test for statistical significance.

