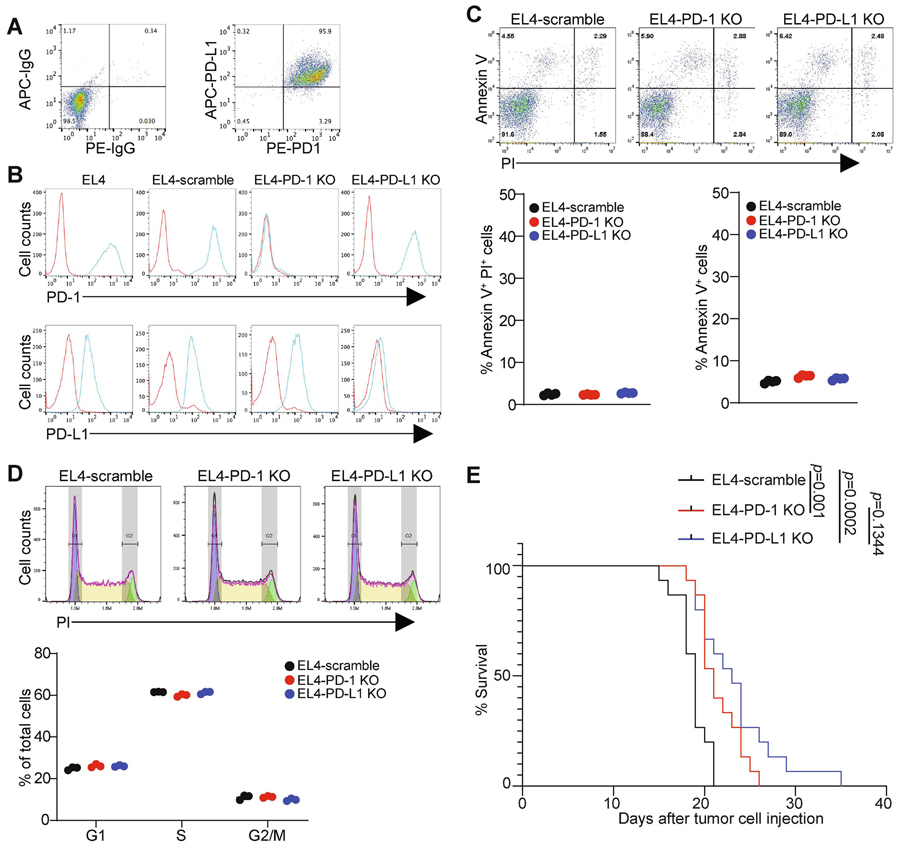
Figure 4. Function of PD-1 and PD-L1 in T lymphoma cell growth in vitro.
A. EL4 cells were stained with IgG isotype controls or anti-PD-1 and anti-PD-L1 antibodies and analyzed by flow cytometry. Shown is the representative dot plots of the cellular phenotypes. B. The indicated EL4 cells were stained with anti-PD-1 and anti-PD-L1 mAbs and analyzed by flow cytometry. C. The indicated cells were stained for propidium Iodide (PI) and Annexin V and analyzed by flow cytometry. Shown are representative dot plots. Apoptotic cell death (Annexin V+PI+) and apoptosis (Annexin V+) were quantified. Each circle represents each measurement. Results are representatives of two independent experiments. D. The indicated cells were allowed to grow logarithmically for 36 h. Cells were then fixed and stained by PI and analyzed by flow cytometry for cell cycle. Shown are representative images of cell cycle analysis output for the indicated cells (left panel). The cell cycle phases as shown at the left were quantified. Each circle represents each measurement. Results are representatives of two independent experiments. E. The indicated cells were injected intraperitoneally into C57BL/6 mice (n=15 for each cell lines) Mouse survival was recorded. P value was calculated by logrank.

