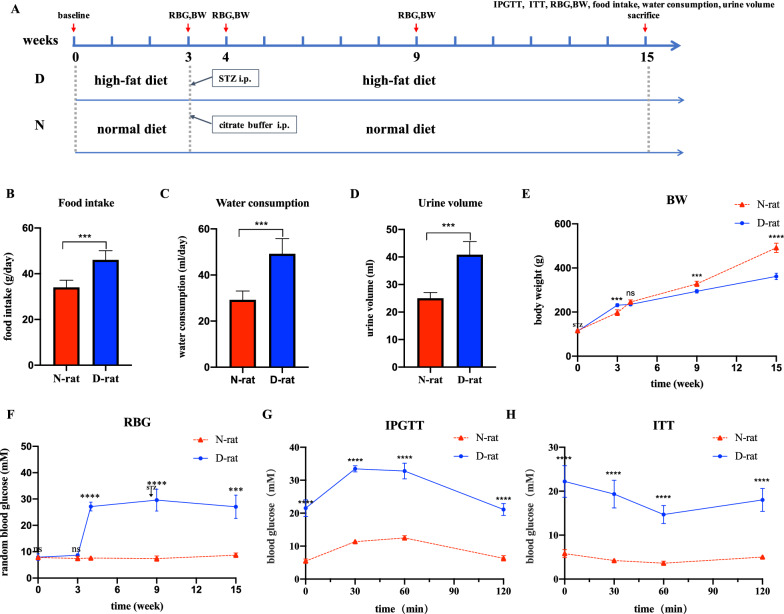
Fig. 1.
Establishment and evaluation of HFD/STZ-induced T2DM rat models. a Scheme of animal treatments. b–d Food intake, water consumption and urine volume of normal and T2DM rats at 12 weeks after STZ injection. e–f Body weight and random blood glucose levels at the time points before HFD, before STZ injection, one week after STZ injection, 6 weeks after STZ injection and 12 weeks after STZ injection. g–h Blood glucose levels during IPGTT and ITT in normal versus T2DM groups at 12 weeks after STZ injection. Data are presented as the mean ± SD. n = 5, ***p < 0.001, ****p < 0.0001

