Figure 3.

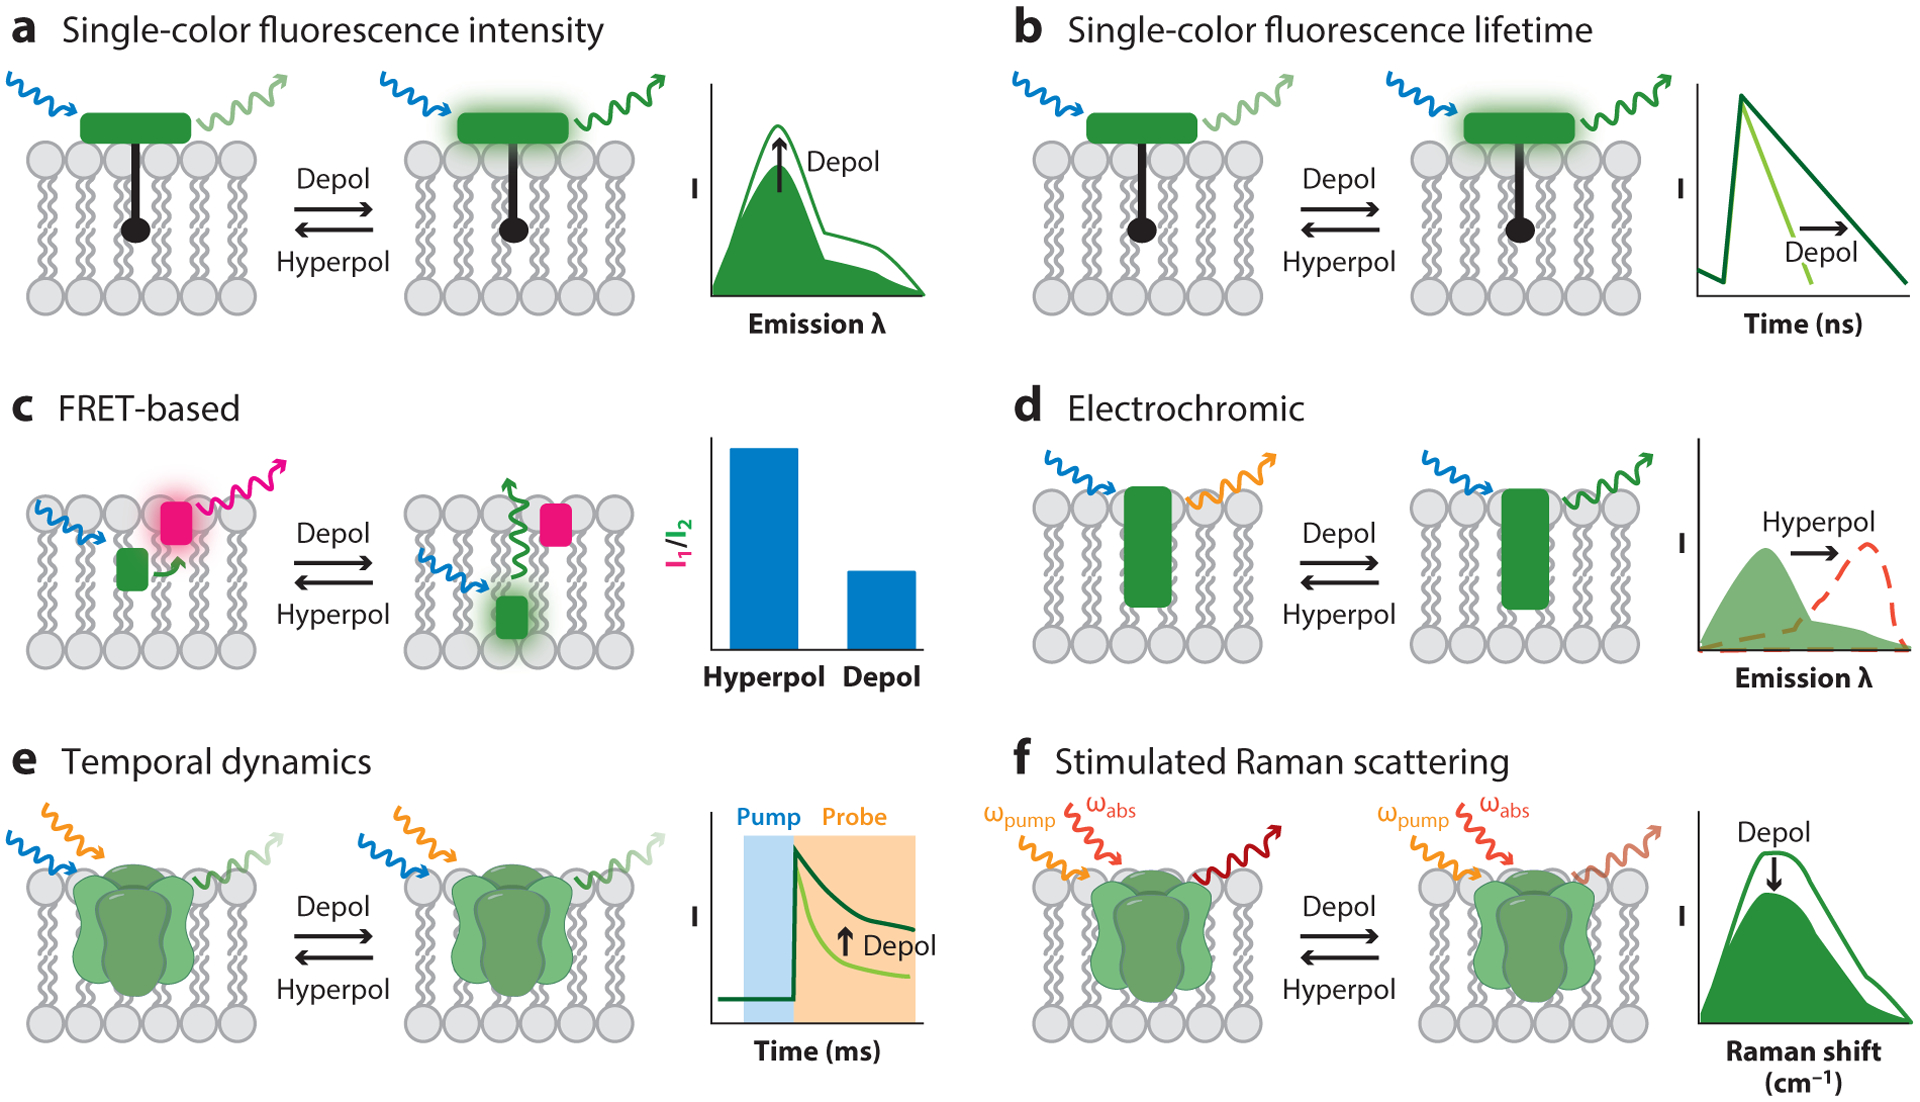
Optical strategies for reporting absolute Vmem. (a) Single-color fluorescence intensity recordings detect changes in Vmem by changes in a sensor’s fluorescence quantum yield (shown), extinction coefficient, or cellular concentration. This technique generally cannot report absolute Vmem optically, although estimates can be made if calibrations are performed for every cell of interest. (b) Single-color fluorescence lifetime can report absolute Vmem, particularly if the Vmem sensor operates via photoinduced electron transfer.(c) FRET-based sensors show differences in the FRET ratios of two fluorophores, often resulting from Vmem-dependent changes in the distance between the two. The diagram shows a FRET-oxonol system. (d) The excitation and/or emission spectra of electrochromic dyes depend on the electric field in the plasma membrane. (e) Certain GEVIs show Vmem-related differences in the temporal dynamics of the absorption of their excited state. (f) SRS imaging reports changes in Vmem-dependent vibrational frequencies. Abbreviations:λ, wavelength; depol, depolarization; FRET, Förster resonance energy transfer; GEVI, genetically encoded voltage indicator; hyperpol, hyperpolarization; SRS, stimulated Raman scattering; Vmem, membrane potential.
