
FIGURE 3.
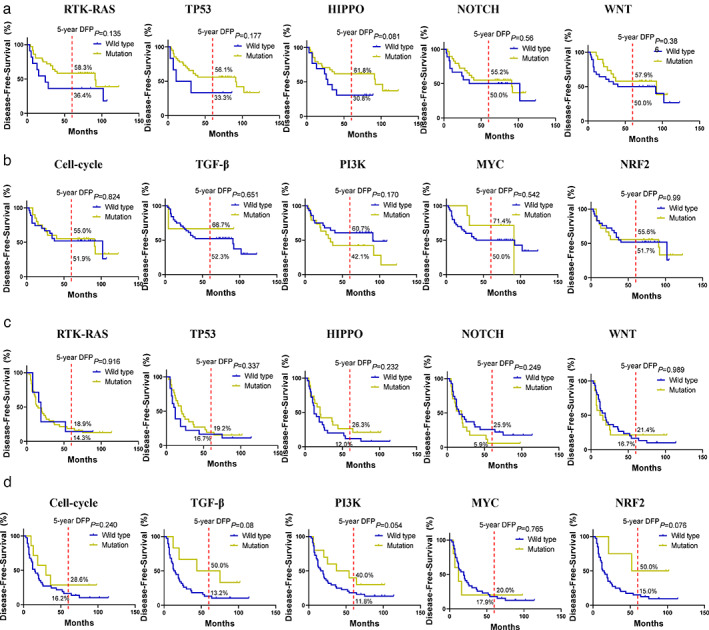
Kaplan–Meier curves of disease‐free survival (DFS) stratified by the 10 oncogenic pathways in squamous cell carcinoma (SCC) and adenocarcinoma (ADC). (a) SCC. (b) ADC
Official websites use .gov
A
.gov website belongs to an official
government organization in the United States.
Secure .gov websites use HTTPS
A lock (
) or https:// means you've safely
connected to the .gov website. Share sensitive
information only on official, secure websites.
Kaplan–Meier curves of disease‐free survival (DFS) stratified by the 10 oncogenic pathways in squamous cell carcinoma (SCC) and adenocarcinoma (ADC). (a) SCC. (b) ADC