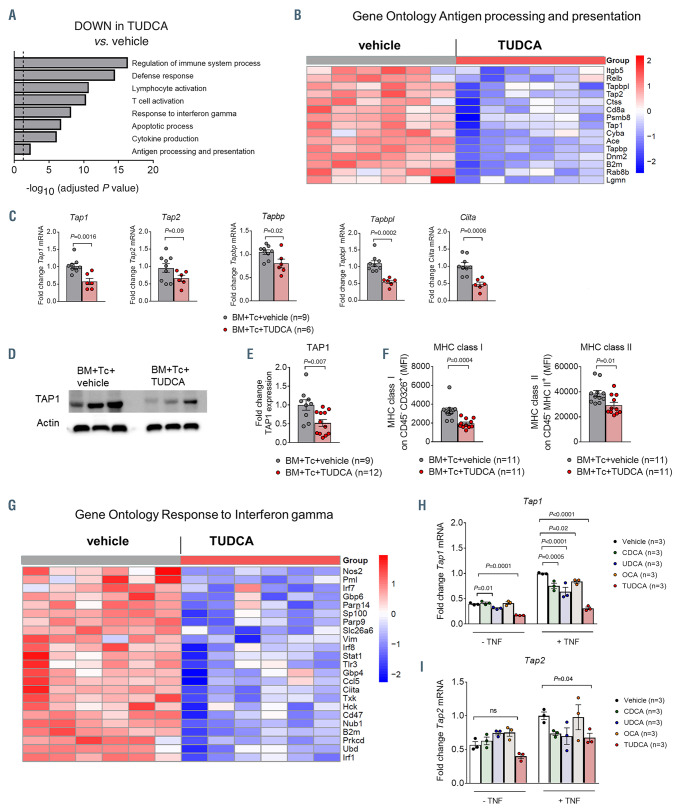
Figure 4.
Tauroursodeoxycholic acid reduces intestinal antigen presentation. (A to G) Small intestinal samples were isolated from recipient mice treated with vehicle or tauroursodeoxycholic acid (TUDCA), on day 14 after bone marrow transplantation (BMT) (C57BL/6 to BALB/c model). (A) Identification of significantly downregulated Gene Ontology terms in animals treated with TUDCA. The dotted line corresponds to P=0.05 (log -0.05=1.29). (B) Heat map based on microarray analysis showing the differentially regulated genes (q-value<0.05) that belong to the term ‘antigen processing and presentation’ from the Gene Ontology database. Data were pooled from two independent experiments, n=6 mice per group, P=0.004. The color code represents the Z-score log2 intensity. (C) Quantitative real-time polymerase chain reaction (PCR) analysis of the mRNA expression of selected genes with Actb as a reference gene. Data were pooled from two independent experiments, numbers (N) represent individual mice. P-values were calculated using the unpaired two-tailed Student’s t-test. (D) Expression of TAP1 protein quantified by western blot. Representative western blot from n=3 mice per group. (E) Quantification of TAP1 protein expression. Data were pooled from two independent experiments, numbers (N) represent individual mice. P-values were calculated using the unpaired two-tailed Student’s t-test. (F) Flow cytometric quantification of major histocompatibility complex (MHC) class I expression on CD326+ (EpCAM+) cells (left panel) and MHC class II expression on CD45– MHC class II+ cells (right panel). Data were pooled from two independent experiments, numbers (N) represent individual mice. P-values were calculated using the unpaired two-tailed Student’s t-test. (G) Heat map based on microarray analysis showing the differentially regulated genes (q-value<0.05) that belong to the term ‘Response to interferon ’ from the Gene Ontology database. Data were pooled from two independent experiments, n=6 mice per group, P=6.49x10⁻⁹. The color code represents the Z-score log2 intensity. (H and I) Quantitative real-time PCR analysis of the mRNA expression of Tap1 (panel H) and Tap2 (panel I) with Actb as a reference gene in MODE-K cells treated with TNF ± chenodeoxycholic acid (CDCA), ursodeoxycholic acid (UDCA), 6-ethylchenodeoxycholic acid (obeticholic acid, OCA) and TUDCA for 48 hours. Representative data from one of two independent experiments with n=3 replicates/group are presented. P-values were calculated using the ordinary one-way ANOVA test with correction for multiple comparisons; ns: not significant.

