Figure 5.
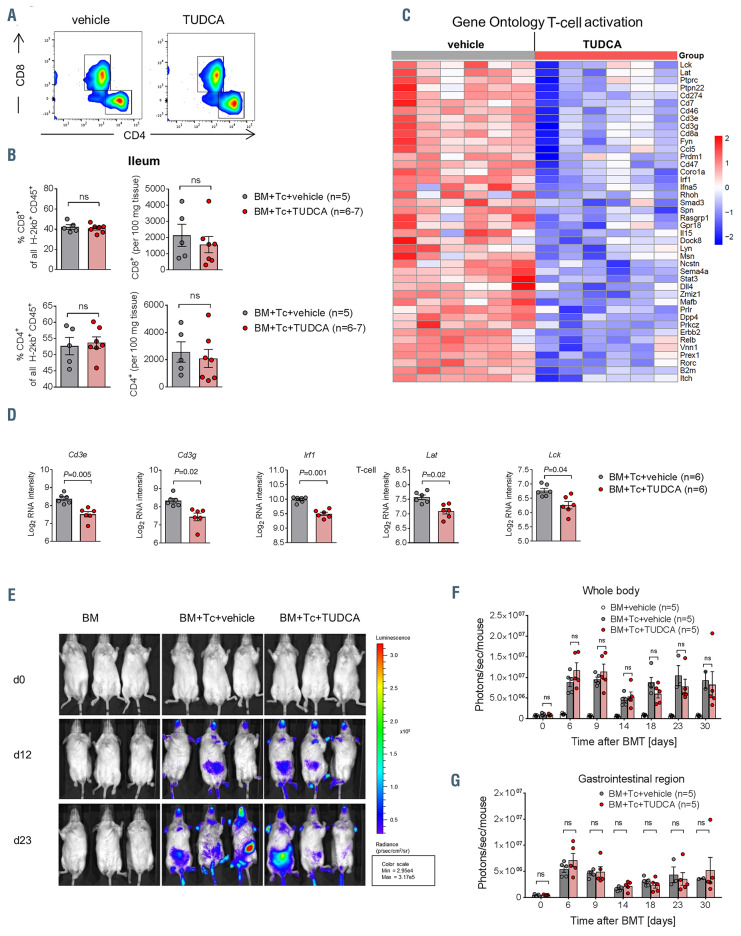
Tauroursodeoxycholic acid administration changes the transcriptional signature of T cells in the intestine but preserves their systemic expansion. (A and B) Flow cytometric analysis of T cells isolated from the small intestinal lamina propria of recipient animals on day 14 after bone marrow transplantation (BMT) (C57BL/6 in BALB/c model). (A) Representative flow cytometry dot plots. (B) Relative (left panel) and absolute (right panel) quantification of CD8+ and CD4+ T cells. Representative data from one of two biologically independent experiments, numbers (N) represent individual mice. P-values were calculated using the two-tailed unpaired Student’s t-test; ns: not significant. (C) Heat map based on microarray analysis (performed as in Figure 4) showing the differentially regulated genes (qvalue< 0.05) that belong to the term ‘T-cell activation’ from the Gene Ontology database. Data were pooled from two independent experiments, n=6 mice per group, P=4.6x10⁻¹¹. The color code represents the Z-score log2 intensity. (D) Log2 RNA intensity values for selected genes belonging to the GO term “T-cell activation”. Data were pooled from two independent experiments, numbers (N) indicate individual mice. An adjusted P-value calculated as described in the Methods is presented. (E) BALB/c mice underwent transplantation as described in Figure 3C using luciferase-transgenic T cells. Representative bioluminescence images for T-cell trafficking on different time points after transplantation. (F and G) Quantification of the bioluminescence measurement performed as described in (D). Signal was quantified either from the whole body (F) or from the gastrointestinal region only (G). One of three independent experiments with n=5 mice per group is shown. P-values were calculated using the ordinary one-way ANOVA test with correction for multiple comparisons.

