Figure 6.
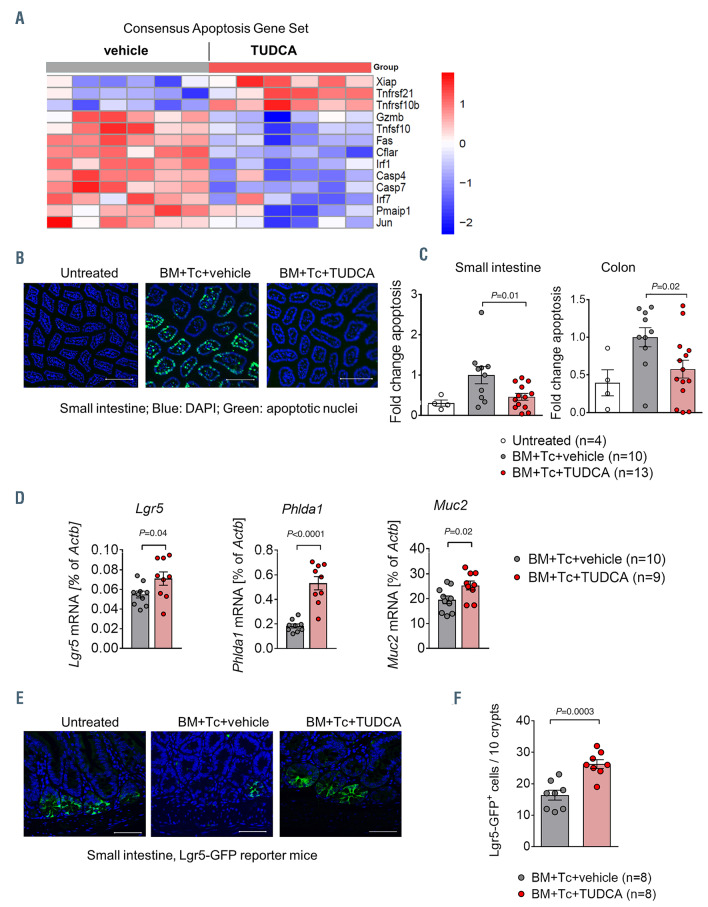
Tauroursodeoxycholic acid decreases intestinal apoptosis. (A to D) Small intestinal samples were isolated from recipient mice which were treated with vehicle or tauroursodeoxycholic acid (TUDCA), on day 14 after bone marrow transplantation (BMT) (C57BL/6 to BALB/c model). (A) Heat map based on microarray analysis showing the differentially regulated genes (q-value<0.05) from the gene set ‘apoptosis’ from the CONSENSUS database (small intestine, day 14 after BMT). Data were pooled from two independent experiments, n=6 mice per group, P=0.001. The color code represents the Z-score log2 intensity. (B) Representative immunofluorescence images of TUNEL-stained paraffin sections from the small intestine (day 14 after BMT, blue: DAPI, green: apoptotic TUNEL staining). Scale bars 200 m. (C) Quantification of apoptotic nuclei in the small intestine and the colon was obtained using the Olympus ScanR analysis software (day 14 after BMT). Data were pooled from two independent experiments, numbers (N) indicate individual mice. P-values were calculated using the ordinary one-way ANOVA test with correction for multiple comparisons. (D) Quantitative real-time polymerase chain reaction (PCR) analysis of the mRNA expression of the intestinal stem cell markers Lgr5 and Phlda1 and the goblet cell marker Muc2 with Actb as a reference gene (small intestine, day 14 after BMT). Data were pooled from two independent experiments, numbers (N) indicate individual mice. P-values were calculated using the unpaired two-tailed Student’s t-test. (E and F) B6.129P2-Lgr5tm1(cre/ERT2)Cle/J mice (H-2kb) were transplanted and treated with TUDCA as described in Figure 3A. On day 14 after BMT, the small intestine was analyzed by immunofluorescence for the number of green fluorescent protein positive (GFP+) intestinal stem cells. (E) Representative images obtained using confocal microscopy (blue: DAPI, green: GFP). Scale bars 50 m. (F) Quantification of data pooled from two independent experiments, N numbers represent individual mice. The P-value was calculated using the unpaired twotailed Student’s t-test.

