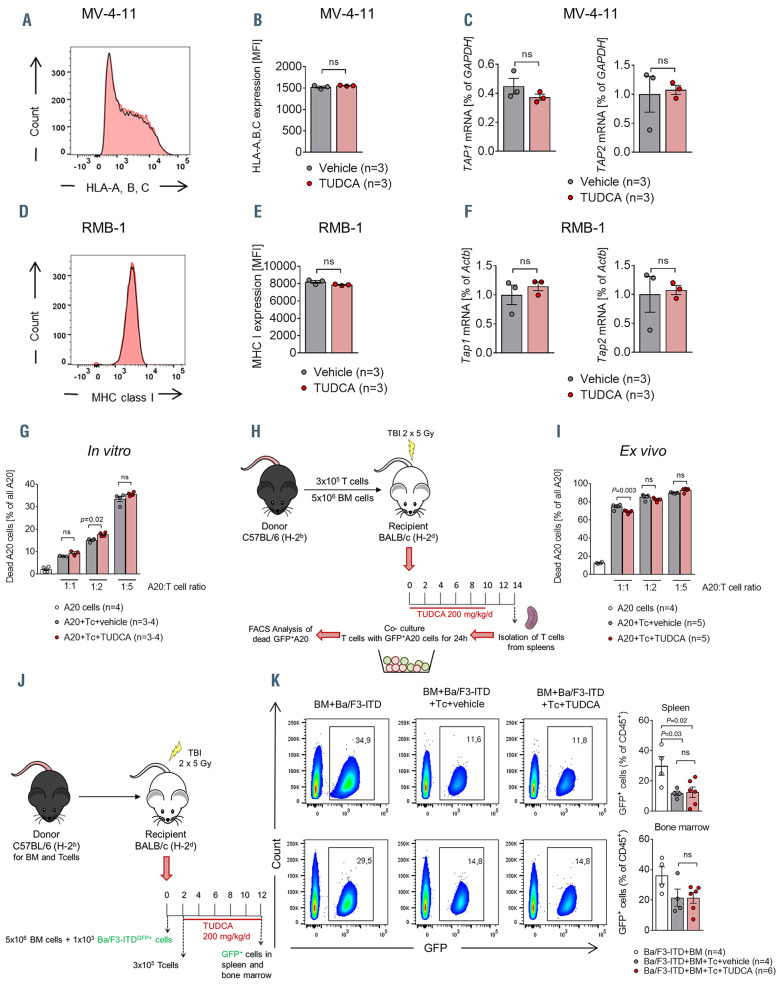
Figure 7.
The graft-versus-leukemia/lyphoma effect is preserved despite tauroursodeoxycholic acid administration. (A to F) MV-4-11 and RMB-1 cells were cultured for 72 hours (h) with or without addition of tauroursodeoxycholic acid (TUDCA). One representative result from three independent experiments performed in technical triplicates is shown for panel (A) and (D). In panels (B), (C), (E) and (F) data were pooled from three independent experiments performed in technical duplicates or triplicates. P-values were calculated using the two-tailed unpaired Student’s t-test; ns: not significant. (A) Representative histograms from flow cytometric analysis of human leukocyte antigen (HLA) A, B, C expression on MV-4-11 cells. (B) Quantification of HLA A, B and C expression on MV-4-11 cells. (C) Quantitative polymerase chain reaction (PCR) analysis of the expression of the antigen presentation-related genes TAP1 and TAP2 in MV-4-11 cells with glyceraldehyde 3-phosphate dehydrogenase (GAPDH) as reference gene. (D) Representative histograms from a flow cytometric analysis of major histocompatibility complex (MHC) class I expression on RMB-1 cells. (E) Quantification of MHC class I expression on RMB-1 cells. (F) Quantitative PCR analysis of the expression of the antigen presentation-related genes Tap1 and Tap2 in RMB-1 cells with Actb as reference gene. (G) C57BL/6 CD8+ T cells were activated with allogeneic (BALB/c) dendritic cells for 72 h and treated with 500 M TUDCA or vehicle prior to incubation with A20 lymphoma cells. The percentage of dead A20 cells after 24 h of incubation was analyzed by flow cytometry. Representative data from one of two biologically independent experiments performed with three to four technical replicates respectively. (H) Experimental model for assessing the graft-versus-ligand (GvL) response of allogeneic T cells ex vivo. BALB/c mice underwent bone marrow transplantation (BMT) as described in Figure 3C and T cells from spleens were isolated for subsequent co-culture with A20 cells on day 14 after BMT. (I) Flow cytometric quantification of dead A20 lymphoma cells co-cultured with CD4+ and CD8+ T cells re-isolated from the spleens of recipient mice on day 14 after BMT as described in (H). Representative data from one of two biologically independent experiments performed with four to five technical replicates respectively. P-values were calculated using the ordinary one-way ANOVA test with correction for multiple comparisons, ns: not significant. (J) Experimental model for assessing the GvL response in vivo. BALB/c mice underwent BMT with additional injection of green fluorescent protein positive (GFP+) Ba/F3-ITD leukemia cells. Allogeneic T cells were transferred two days later and animals were treated with 200 mg/kg body weight TUDCA or vehicle for another 10 days. (K) Flow cytometric analysis of spleen and bone marrow for the percentage of GFP+ cells on day 12 after tumor injection. N numbers represent individual mice. Left panel: representative flow cytometry plots. Right panel: quantification, numbers (N) represent individual mice. P-values were calculated using the ordinary one-way ANOVA test with correction for multiple comparisons, ns: not significant.

