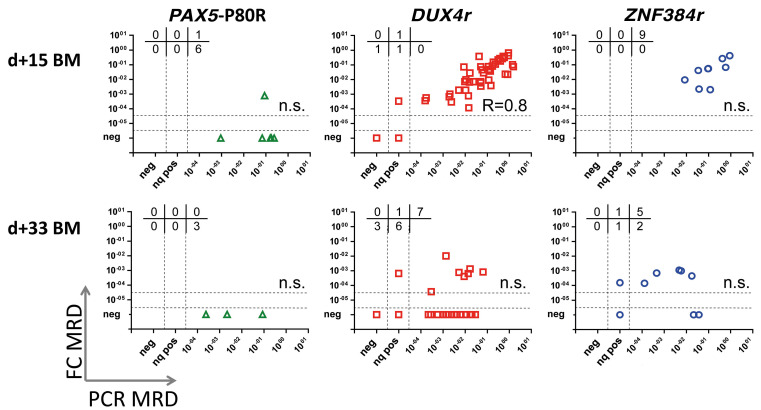
Figure 3.
Correlation of the mimal reidual disease results obtained by flow cytometry and polymerase chain reaction in selected patient groups. Only samples with appropriate measured sensitivity are shown (the flow cytometry [FC] sensitivity is 0.0001 if the polymerase chain reaction [PCR]-determined minimal residual disease [MRD] <0.01; for samples with PCR-determined MRD ≥0.01, the FC measurement sensitivity is at least one log value lower than the actual PCR-determined MRD log value). In the upper part of each graph, the number of patients with MRD values FCpos/PCRneg, FCpos/PCRnq pos, and FCpos/PCRpos (upper lane); and FCneg/PCRneg, FCneg/PCRnq pos, and FCneg/PCRpos (bottom lane) are indicated. Spearman's rank correlation coefficient indicated if the P-value was <0.05. Nq pos: nonquantifiable positivepositive; BM: bone marrow.

