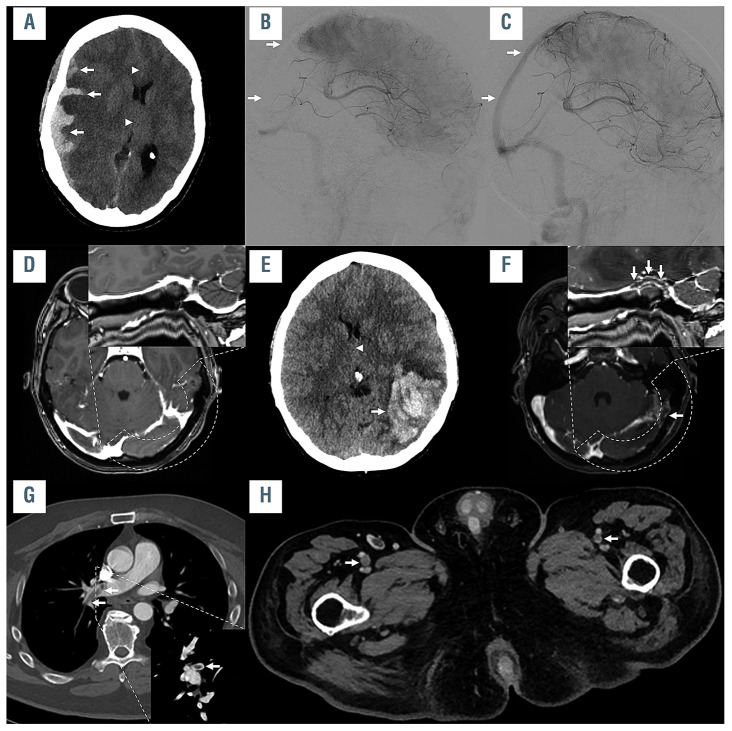
Figure 1.
Imaging example of three illustrative cases. Imaging examples of case #1 (A to C), case #8 (D to F) and case #4 (G and H). In case #1, non-enhanced computed tomography imaging (A) showed a parenchymal and subdural hemorrhage (arrows in A), causing a midline shift (arrowheads in A). Digital subtraction angiography was performed (B) showing thrombosis of the right sigmoid and transverse sinus, superior sagittal sinus (arrows in B), and straight sinus. Angiography after mechanical recanalization (C) shows the recanalized cerebral sinuses (superior sagittal sinus marked with arrows). In case #8, cerebral imaging 7 days after vaccination was unremarkable (curved reconstruction of the left transverse and sigmoid sinus shown in the right upper corner of D and F). She worsened, which led to a repeated cerebral imaging, showing a large intraparenchymal hemorrhage in the left temporal lobe (arrow in E), causing midline shift (arrowhead in E), caused by a thrombosis of the transverse and sigmoid sinus (arrows in F), as well as of the adjacent tentorial veins. In case #4, a thrombus in the right pulmonary artery was observed (arrows in E; coronal reconstruction shown in the right lower corner of G). Further imaging also revealed thrombi in the femoral veins on both sides (arrows in H).

