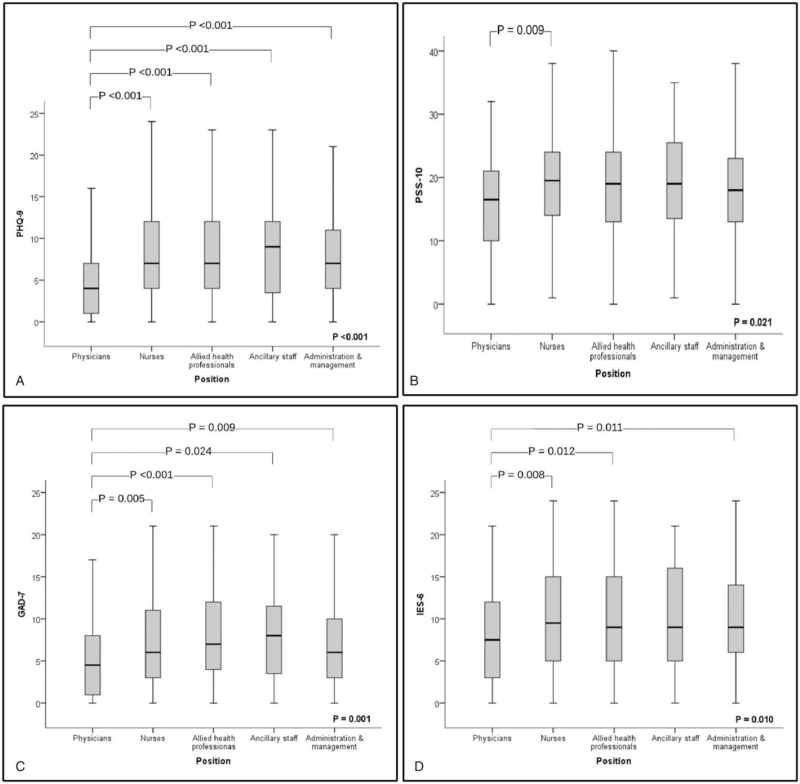
FIGURE 1.
Boxplots of outcome scores according to the position. A: PHQ-9; B: PSS-10; C: GAD-7; D: IES-6. Kruskal–Wallis and Bonferroni corrected pairwise comparisons are reported. The thick line in the middle is the median. The top and bottom box lines show the first and third quartiles. The whiskers show the maximum and minimum values.

