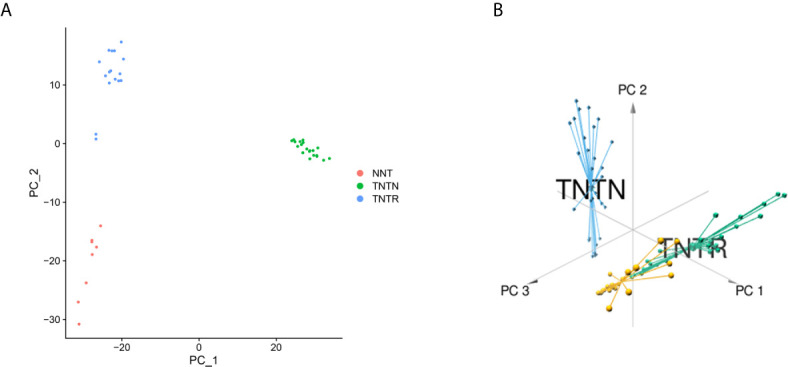
Figure 4.

Identification of principal CRT-related genes through PCA. (A) PCA could separate immune-related genes in GSE68204. Orange dots represent the normal (NNT) group; green dots represent the tumor-non-responsive (TNTN) group; blue dots represent the tumor-reponsive (TNTR) group. (B) 3D distribution plot of PCA. Orange lines represent the normal (NNT) group; green dots represent the tumor-responsive (TNTR) group; blue dots represent the tumor-non-responsive (TNTN) group.
