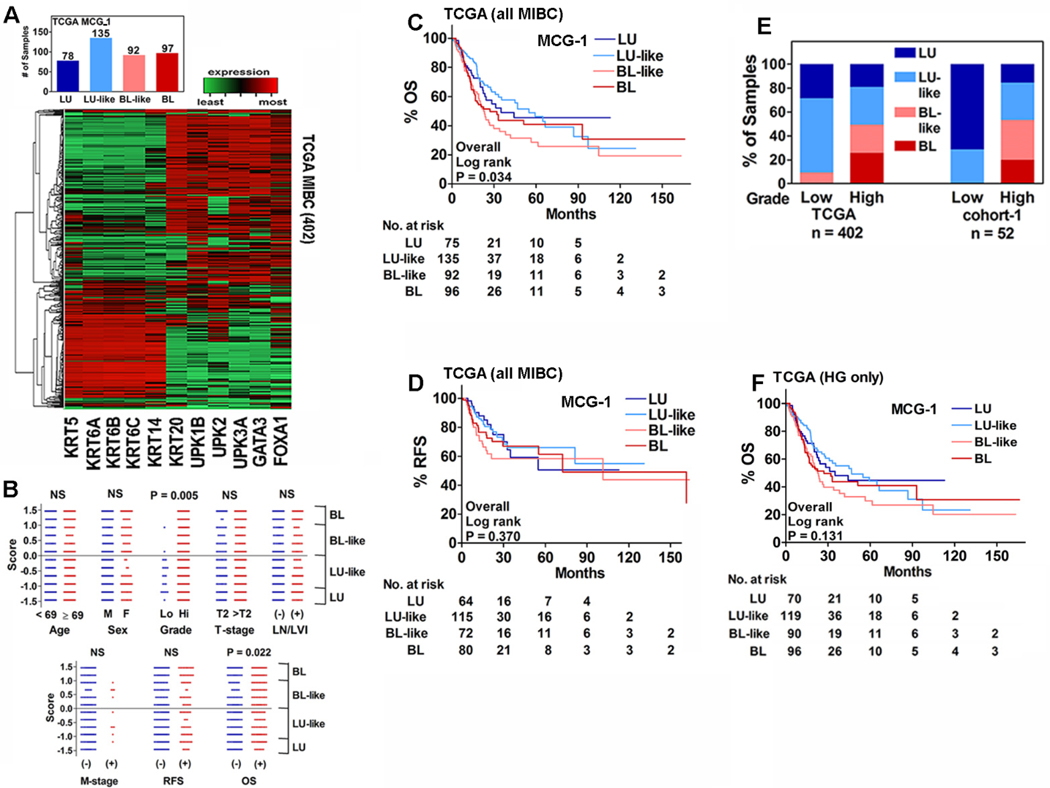
Figure 3: Association of subtypes to clinical parameters, OS and RFS in the TCGA-dataset and the influence of grade.
A. Hierarchical clustering of 402 MIBC specimens in the TCGA-dataset and the distribution of LU, LU-like, BL and BL-like subtypes. B. Comparison of specimen subtype scores by clinical parameters. Each symbol represents an individual specimen. P-values generated by Mann-Whitney U test are two-tailed. C and D. Kaplan-Meier plots for OS (C) and RFS (D) of MIBC specimens in the TCGA-dataset stratified by MCG-1 subtypes. E. Distribution of the molecular subtypes between low- and high-grade tumors in the TCGA and cohort-1 datasets. Note: There were only high-grade MIBC specimens in the Oncomine-dataset. F. Kaplan-Meier plot for OS including only high-grade MIBC specimens in the TCGA-dataset.

