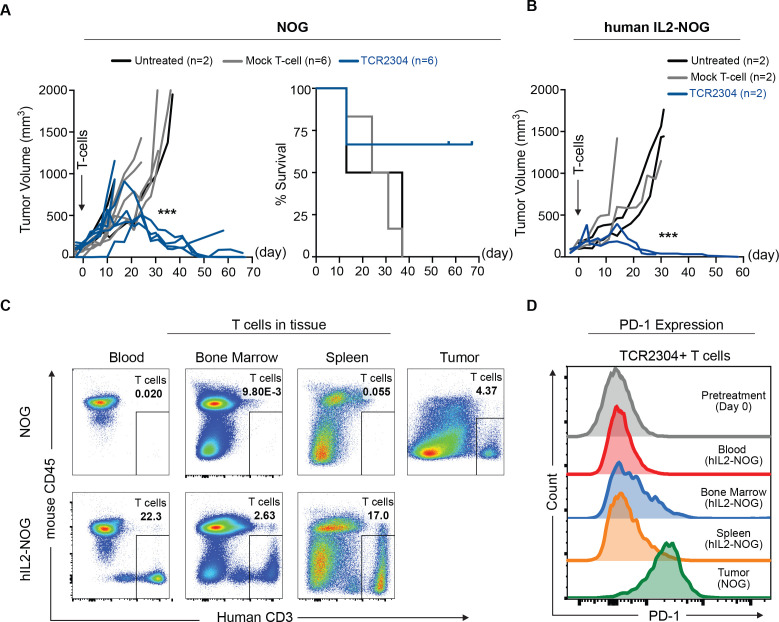
Figure 5.
Therapeutic efficacy of TCR-T cells in OCI-Ly3 xenograft mouse models. NOG and hIL2-NOG mice were subcutaneously injected with 5×10⁶ HLA*B07:02 expressing OCI-Ly3 cells. Treatment with 1×10⁷ T cells was given by intravenous injection after tumors reached the predetermined size of 100 mm3. (A) Change of tumor volume (significance analysis by two-way ANOVA, showing difference of tumor volume on day 31: ***p<0.001) and survival after treatment start in NOG mice. (B) Change of tumor volume after treatment start in hIL2-NOG mice. Significance analysis by two-way ANOVA, showing difference on day 30: *p<0.05, **p<0.01, ***p<0.001, ****p<0.0001. (C) Flow cytometric analysis of T cells in tissues of TCR-T cell-treated common NOG and hIL2-NOG mice, 58 days after treatment. (D) PD-1 expression in TCR-T cells in tissues of hIL2-NOG and common NOG mice on day 58 after treatment start, analyzed by flow cytometry. ANOVA, analysis of variance; IL, interleukin; TCR, T-cell receptor.

