
Figure 2. Increased accumulation of myeloid cell populations in inflamed tissue.
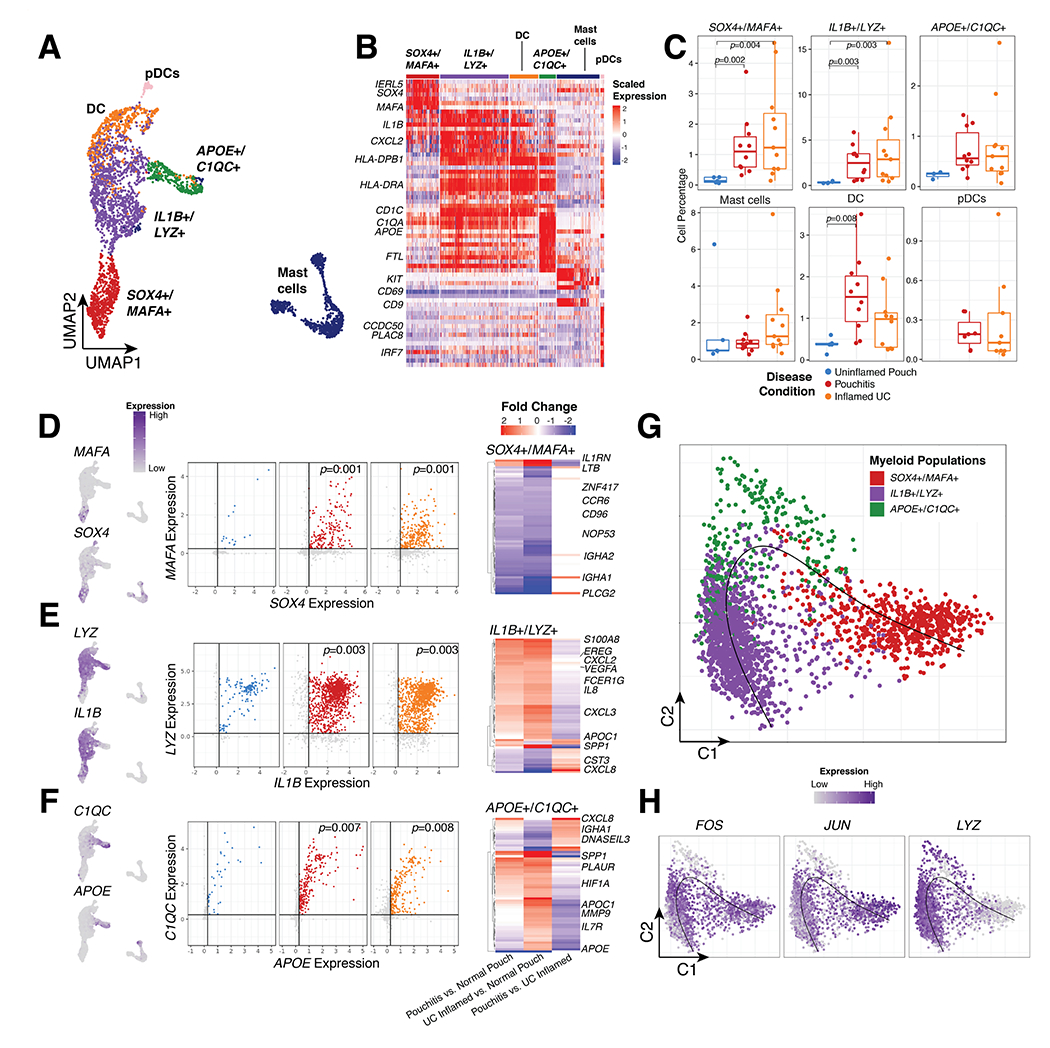
(A) UMAP of myeloid cell types and (B) gene expression of significant markers genes. (C) Relative frequency of major myeloid cell types as a percentage of total cells per patient. (D-F) UMAP of marker genes pairs (left), gene by gene expression plots (center) and differentially expressed genes between Uninflamed Pouch, Pouchitis and UC inflamed samples in 3 major monocyte/macrophage populations. Significantly expressed genes are determined by Log2 fold change >0.75 and adjusted p-value <0.05. Gene by gene expression plots indicate in silico gating at a scaled expression value of 0.25, black lines. gating (G) Diffusion map of monocyte/macrophages clusters (top) with pseudotime projection (black line). (H) Diffusion map of normalized FOS, JUN and LYZ expression. P-values indicate significance testing for Wilcoxon ranked test.