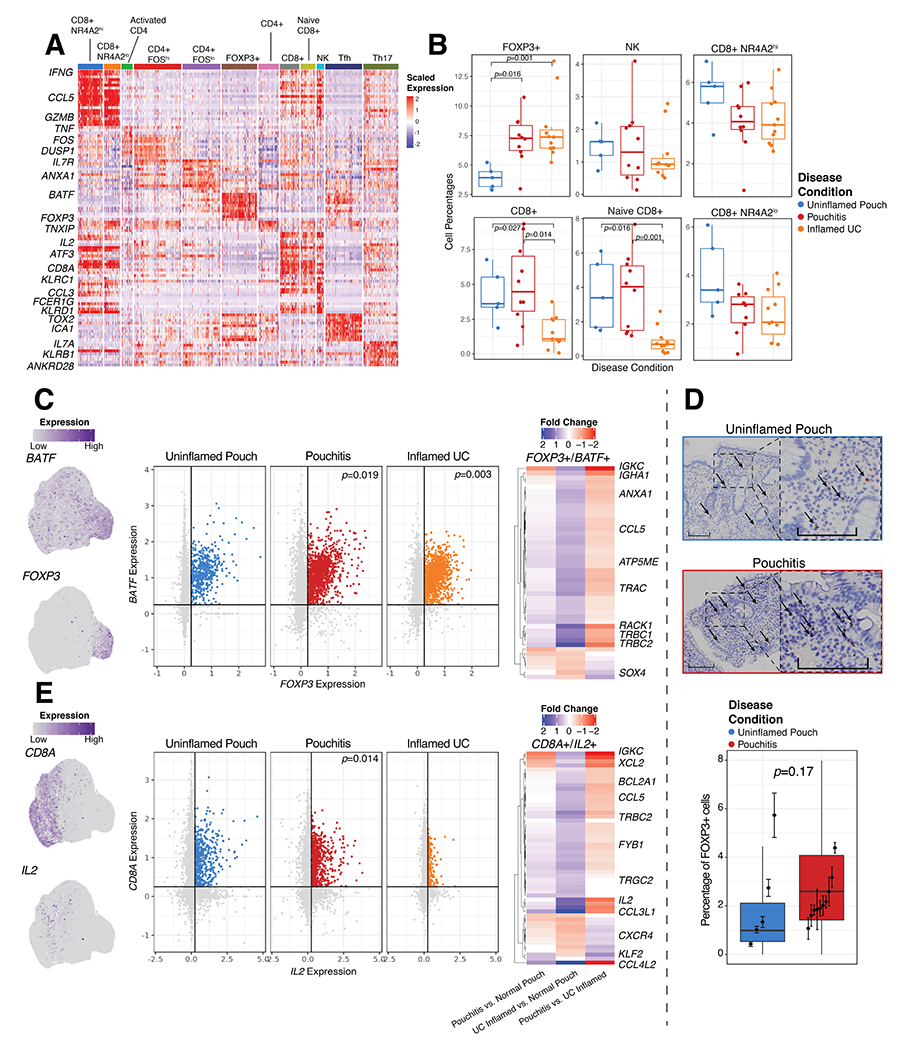
Figure 3. Dysregulated T cell compartment in inflamed tissue.

(A) Gene expression of significant markers genes in 12 T cell types. (B) Relative frequency of selected T cell clusters as a percentage of total cells per patient. (C) UMAP (left) and expression plots (center) of FOXP3 and BATF expression in T cells, and DE heat maps of genes with log2 fold change between Uninflamed Pouch, Pouchitis and UC inflamed samples (right) in FOXP3+/BATF+ T cells. (D) Representative FOXP3 stained pouch tissue sections (top) and quantification (bottom), where dark brown colored cells indicate FOXP3 nuclear expression and quantification of percent FOXP3+ cells in 5 uninflamed patient samples and 10 pouchitis patient samples. Significance was determined by. (E) UMAP (left) and expression plots (center) of CD8A and IL2 expression in T cells (left), and DE heat maps of log2 fold change between Uninflamed Pouch, Pouchitis and UC inflamed samples (right) in CD8A+/IL2+ T cells. Significantly differentially expressed genes are determined by Log2 fold change >0.5 and adjusted p-value <0.05. FOXP3 by BATF and CD8A by IL2 expression plot indicate in silico gating at a scaled expression value of 0.25, black lines. P-values indicate significance testing for Wilcoxon ranked test. Scale bars indicate 200μm imaged at 10X magnification.
