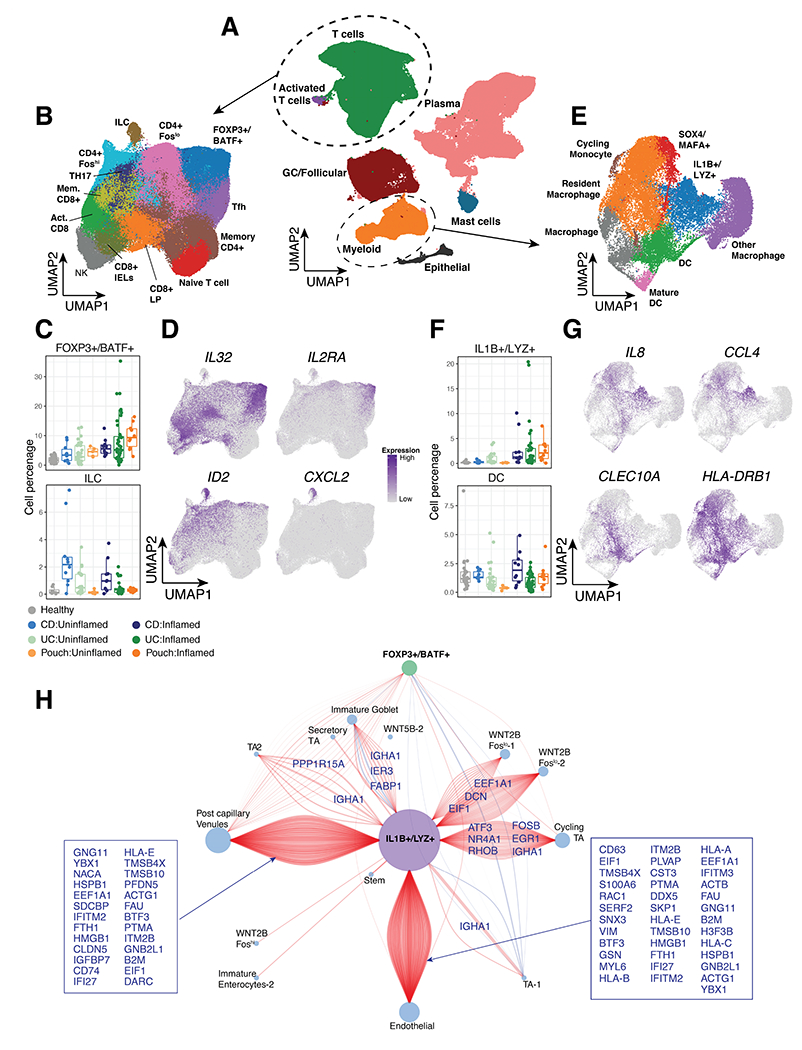
Figure 4. Defining cell states related in active inflammation in pouch, UC and CD.

(A) Integrated UMAP of ~350,000 immune cells from inflamed and uninflamed UC, CD and Pouch patient samples and healthy controls. (B) UMAP of T cell clusters. (C) Relative frequency of FOXP3+/BATF+ Tregs (top) and ILC (bottom) cells as a percentage of total cells per patient and (D) UMAP of representative gene expression markers. (E) UMAP of Myeloid cell clusters. (F) Relative frequency of IL1B+/LYZ+ myeloid cells (top) and DC (bottom) cluster as a percentage of total cells per patient and (G) UMAP of representative gene expression markers. (H) Correlation network of IL1B, LYZ, FOXP3 and BATF expression to non-immune cells from Smillie et al. Positive correlations are shown in red and negative correlations in blue. The size of each node is proportional to the number of connections and connections are annotated by the gene correlation in the non-immune cell.
