
Figure 5. Identification of cell type-specific transcripts and analysis of an independent dataset of patients with IPAA.
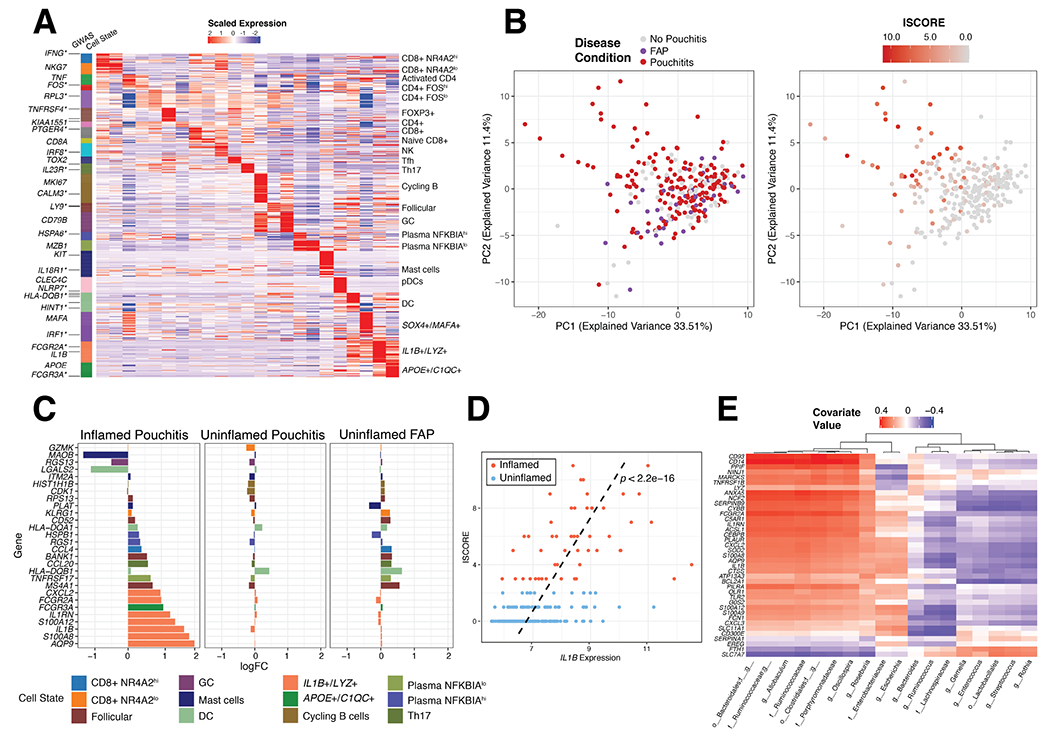
(A) Expression of 706 marker genes for 23 identifiable T, B and Myeloid cell states from scRNA-seq. Asterisks indicate GWAS genes related to IBD. (B) Principal component analysis of 250 IPAA patient samples with familial adenomatous polyposis (FAP), active pouchitis (PI) or no pouchitis (NP) based on the 706-gene signature and colored by disease condition (left) and inflammation score (ISCORE) (right). (C) Top 10, by log fold change, immune-associated marker genes in inflamed (ISCORE>2) Pouchitis, uninflamed (ISCORE<2) Pouchitis and uninflamed FAP patient samples compared to no pouchitis. Fold changes were determined with limma64 version 3.38.3 (D) Linear relationship between Inflammation Score (ISCORE) and IL1B expression was assessed by a linear model with covariates gender and antibiotic treatment within 30 days of visit (yes/no) and the line of best fit from this model was plotted as a dashed black line along with the p-value, p<2.2e-16. (E) sPLS analysis of gene signature for IL1B+/LYZ+ monocyte/macrophages compared to microbial taxa measured by 16S rRNA sequencing of the 250 patient IPAA samples from Morgan et al. Significant genes determined by log2 Fold Change