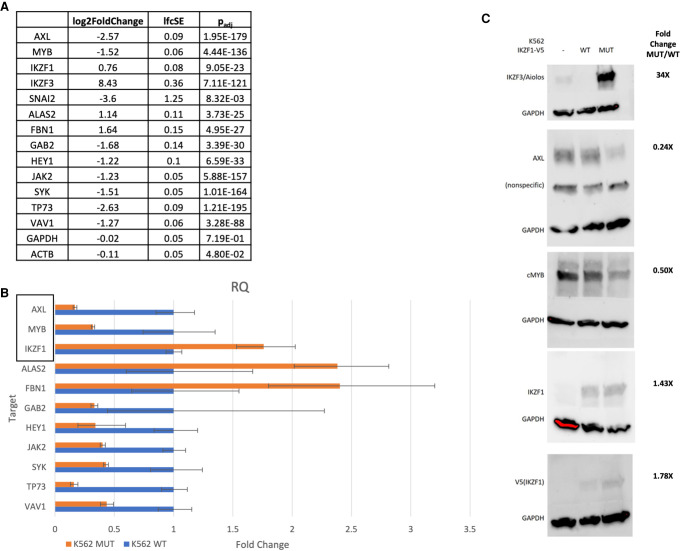
Figure 5.
Differentially expressed genes validated by quantitative polymerase chain reaction (qPCR) and immunoblot. (A) RNA-seq log2 fold change, standard error, and adjusted P-value for selected genes present as nodes in network analysis. (B) Targets identified as critical nodes in network analysis were selected for validation by qPCR. TaqMan probes were utilized to perform qPCR. Relative quantity values by ΔΔ−CT between wild-type (WT) and mutant (MUT) samples (n = 3 biological replicates, n = 3 technical replicates) normalized to β-actin and GAPDH are reported. Genes highlighted by the rectangle are included in immunoblot analysis. IKZF3/Aiolos signal was undetected after 40 cycles in WT samples but displayed a value of ∼32 CT in MUT samples. SNAI2 amplified in WT samples but was undetected in MUT samples after 40 cycles. (C) Targets were further validated by immunoblot. Immunoblots were quantified using density analysis in ImageJ software.

