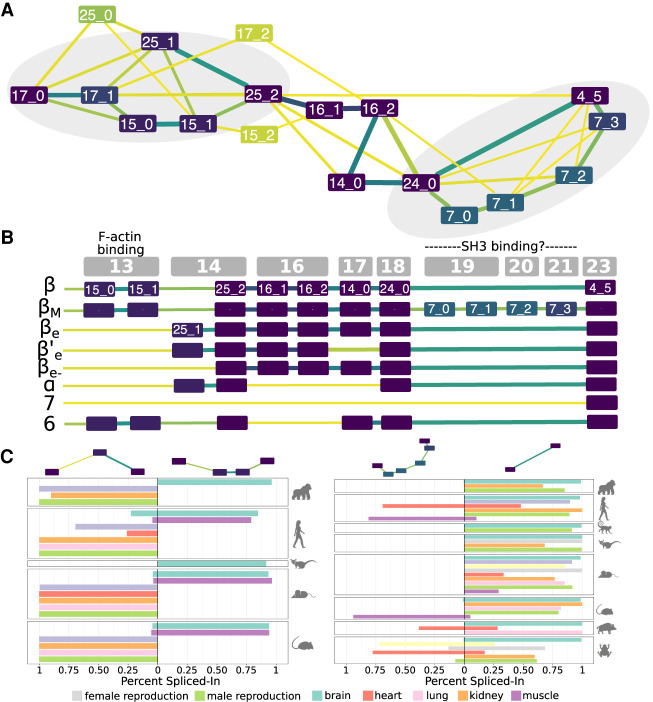
Figure 3.
Transcript variability in the CAMK2B linker. (A) Evolutionary splicing subgraph computed by ThorAxe starting from 63 transcripts annotated in 10 species. It corresponds to the region linking the kinase and hub domains of CAMK2B. The colors of the nodes and the edges indicate conservation levels, from yellow (low) to dark purple (high). Conservation is measured as the species fraction for the nodes (proportion of species where the s-exon is present) and as the averaged transcript fraction for the edges (averaged transcript inclusion rate of the s-exon junction). For ease of visualization, we filtered out the s-exons present in only one species. The events documented in the literature are located in the gray areas. (B) On top, genomic structure of the human gene. Each gray box corresponds to a genomic exon (nomenclature taken from Sloutsky and Stratton 2020). (Below) List of human transcripts. All of them have been described in the literature, referred to as β (Bulleit et al. 1988), βM (Bayer et al. 1998), βe (Brocke et al. 1995), β′e (Brocke et al. 1995), βe− (Cook et al. 2018), α (Bulleit et al. 1988), 7 (Wang et al. 2000), and 6 (Wang et al. 2000). The functional roles of some exons (Bayer et al. 1998; Khan et al. 2019) are given. (C) Percent-spliced in (PSI) computed from RNA-seq splice junctions for the two documented AS events. The two pairs of alternative subpaths depicted on top are also highlighted on A.

