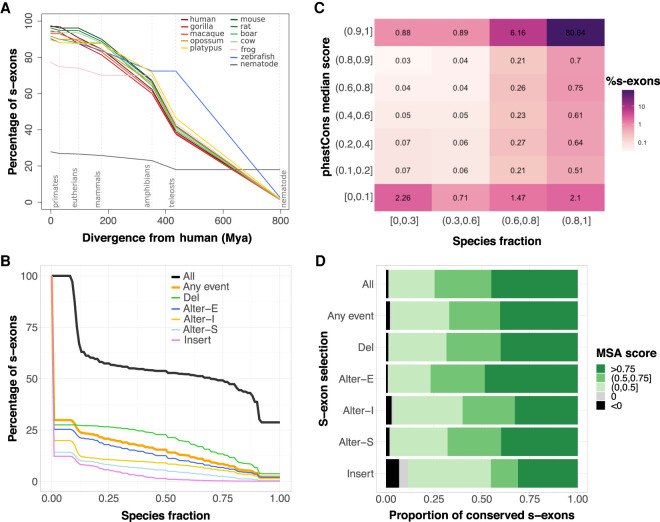
Figure 4.
S-exon evolutionary profiling over the whole protein-coding human genome. (A) Percentages of s-exons conserved at different evolutionary distances from human (represented by dashed vertical lines). Each curve is centered on its corresponding species. The values at the origin are the percentages of conserved (i.e., not species-specific) s-exons. Conservation is then assessed at each evolutionary distance according to the s-exons possessing at least one representative in each phylogroup. For instance, we report 73%–76% of the s-exons of frog (pink curve) as conserved among eutherians (second dashed line) in the sense that they are also conserved in at least one primate (among human, gorilla, macaque) and at least one nonprimate eutherian (among rat, mouse, boar, cow). Likely, conservation up to mammals (68%–72% for frog) would imply at least one primate, one nonprimate eutherian, and one noneutherian mammal. See also Supplemental Figure S10 for a version of this plot focusing on genes with one-to-one orthologs in more than seven species. (B) Cumulative distributions of s-exon species fraction. On the y-axis we report the percentage of s-exons with a species fraction greater than the x-axis value. The different curves correspond to all s-exons (All), only those involved in at least an event (Any event), or only those involved in a specific type of event. (Alter-S) alternative start; (Alter-I) alternative (internal); (Alter-E) alternative end; (Del) deletion; (Insert) insertion. (C) Heatmap of the s-exon phastCons median scores versus the s-exon species fractions. Only the s-exons longer than 10 residues and belonging to genes with one-to-one othologs in more than seven species are shown. (D) Proportions of conserved s-exons displaying very poor (negative score) to very good (score close to one) alignment quality. The MSA score of a s-exon is computed as a normalized sum of pairs. A score of 1 indicates 100% sequence identity without any gap. The proportions are given for different s-exon selections (same labels as in B).

