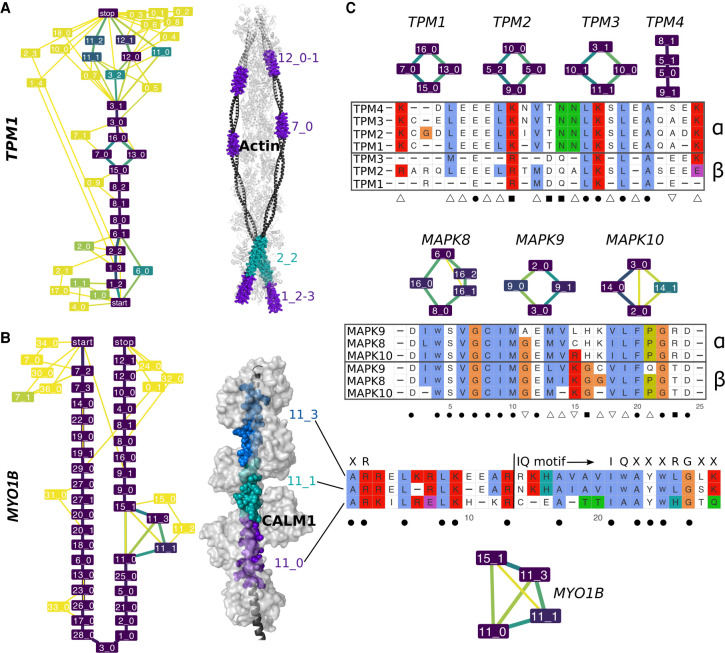
Figure 5.
Examples of evolutionarily conserved events with in-gene paralogy. (A,B) ESGs computed by ThorAxe (left) and the best 3D templates found by HHblits (right); PDB codes 2w49:abuv (Wu et al. 2010) and 2dfs:H (Liu et al. 2006) for TPM1 and MYO1B. On the ESGs, the colors indicate conservation levels, species fraction for the nodes and averaged transcript fraction for the edges (Supplemental Methods). The nodes in yellow are species-specific, whereas those in dark purple are present in all species. The 3D structures show complexes between the query proteins (black) and several copies of their partners (light gray). The s-exons involved in conserved events are highlighted with colored spheres. (C) S-exon consensus sequence alignments within a gene family (TPM on top, MAPK in the middle) or a gene (MYO1B, at the bottom). Each letter reported is the amino acid conserved in all sequences of the corresponding MSA (allowing one substitution). The color scheme is that of Clustal X (Thompson et al. 1997). The subgraphs show the events in which the s-exons are involved. The symbols α and β on the right indicate groups of s-exons defined across paralogous genes based on sequence similarity (Supplemental Methods). The symbols at the bottom denote highly conserved positions across the gene family: (dot) fully conserved position; (square) position conserved only within each s-exon group; (upward triangle) position conserved in the α group only; (downward triangle) position conserved in the β group only. For MYO1B, the start and canonical sequence of the CALM1-binding IQ motif are indicated. The motifs resulting from different combinations of the depicted s-exons are numbered 4, 4/5, and 4/6 in the literature (Greenberg and Ostap 2013).

