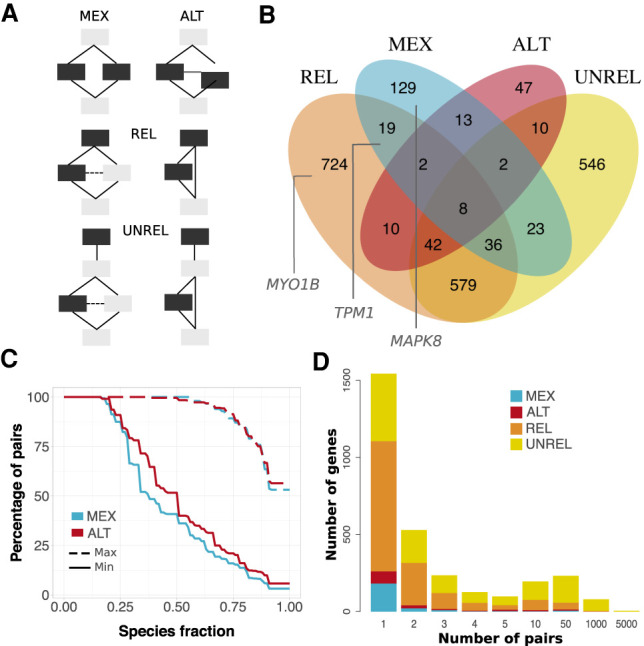
Figure 6.

Alternative usage of similar s-exons. (A) Evolutionary splicing subgraphs depicting different alternative usage scenarios. The detected s-exon pairs are colored in black. (MEX) mutual exclusivity; (ALT) alternative (non-mutually exclusive) usage; (REL) one s-exon is in the canonical or alternative subpath of an event (of any type), whereas the other one serves as a “canonical anchor” for the event; (UNREL) one s-exon is in the canonical or alternative subpath of an event (of any type), whereas the other one is located outside the event in the canonical transcript. Each detected pair is assigned to only one category with the following priority rule: MEX > ALT > REL > UNREL. (B) Venn diagram of the genes containing similar pairs of s-exons. The genes shown in Figure 5 are highlighted in the corresponding subsets. (C) Cumulative distributions of s-exon conservation. On the y-axis we report the percentage of s-exon pairs with species fraction greater than the x-axis value. The solid (respectively, dashed) curve corresponds to the highest (respectively, lowest) species fraction among the two s-exons in the pair. We report values only for the MEX (blue) and ALT (red) categories. (D) Distribution of per-gene s-exon pair number within each of the four categories. For instance, the yellow rectangle at x = 50 gives the number of genes with more than 10 and up to 50 UNREL s-exon pairs.
