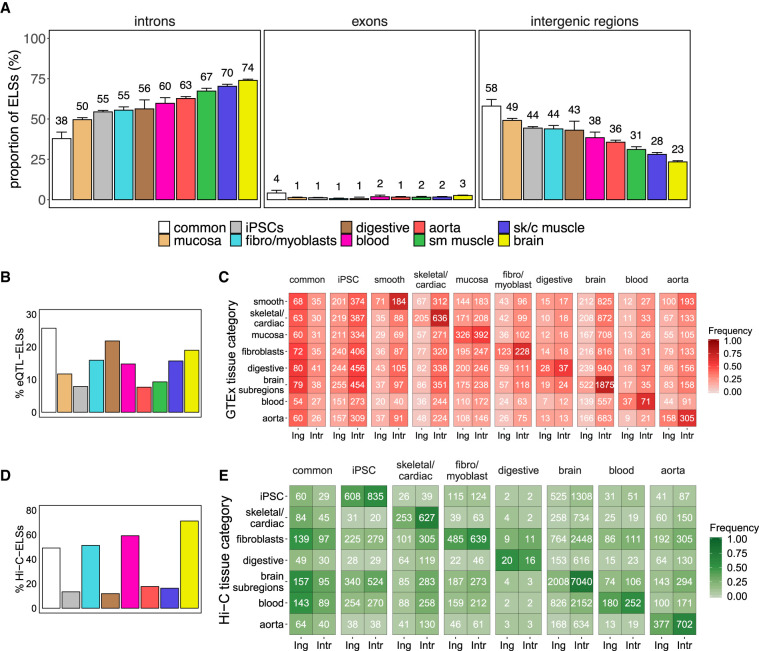
Figure 2.
Intronic location of tissue-specific ELSs. (A) Proportions of common and tissue-specific ELSs, identified in the 33 selected human adult samples that overlap intronic, exonic, and intergenic regions. Error bars represent the 95% confidence interval. (sk/c) skeletal/cardiac, (sm) smooth). (B) Proportion of eQTL-ELSs with respect to the total amount of ELSs in each cluster. (C) Number of intergenic (Ing) and intronic (Intr) cluster-specific ELSs harboring eQTLs detected in the analyzed GTEx tissue samples. Common and iPSCs-specific ELSs were annotated with a composition of tissue-specific significant eQTLs (see Methods). Colored cells represent the proportion of region-specific eQTL-ELSs over the total amount of eQTL-ELSs per cluster. Significant differences were observed between common and tissue-specific annotated eQTL-ELSs (χ2test P-value ≤ 0.05), showing that common annotated ELSs are highly associated with intergenic regions. (D) Proportion of Hi-C-ELSs with respect to the total amount of ELSs in each cluster. (E) Number of intergenic and intronic cluster-specific ELSs overlapping Hi-C-based detected fragments in the analyzed Hi-C tissue samples. Common ELSs were annotated with a composition of tissue-specific significant Hi-C fragments (see Methods). Colored cells represent the proportion of Hi-C-ELSs over the total amount of tissue-specific Hi-C-ELSs per cluster. Significant differences were observed between common and noncommon annotated Hi-C-ELS (χ2 test P-value ≤ 0.05).

