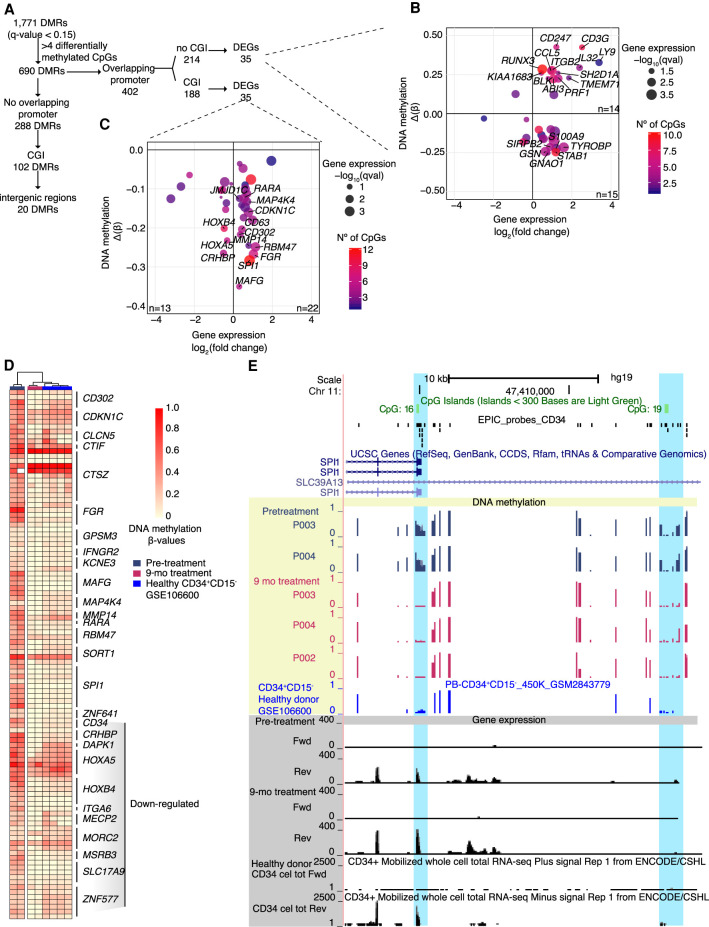
Figure 6.
DNA methylation analysis of differentially methylated regions (DMRs) of human CD34+ cells. (A) Workflow of DMRs analyzed in CD34+ cells. DMRs with more than four differentially methylated CpGs were divided between DMRs overlapping promoters and no promoters. The DMRs overlapping promoters were subdivided between overlapping CpG islands (CGI) or not, and finally correlated to DEGs. The DMRs not overlapping promoters were filtered by overlapping CGI or intergenic regions. (B,C) Correlation plot between DNA methylation and gene expression changes between pretreatment and following 9 mo of HC treatment. DNA methylation of each region is expressed by the difference of the β-value (Δβ) before and following HC treatment (y-axis; n = 2). Gene expression change is expressed by the log2-fold change before and following HC treatment (x-axis; n = 5). Color scale represents the number of differentially methylated CpGs in the region. (B) DMRs that overlap gene promoters of DEGs with no CGIs described in the promoter region. (C) DMRs that overlap CGI at gene promoters of DEGs. (D) Heatmap of individual differentially methylated CpGs located in DMRs overlapping CGIs at pretreatment, 9 mo of HC treatment, and healthy CD34+ cells. Genes associated to the differentially methylated CpGs are indicated. (E) Locus of the promoter and regulatory region of SPI1 with DNA methylation and gene expression levels before and after 9 mo of HC treatment. Yellow shading indicates DNA methylation levels, blue shading indicates significant DMRs, and gray shading denotes gene expression levels.

