Figure 2.
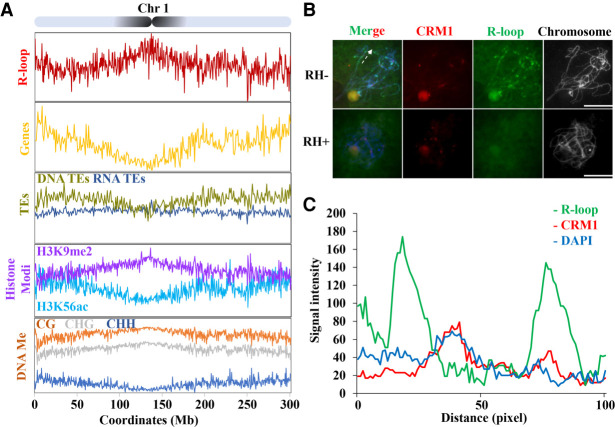
R-loops are enriched in pericentromeric regions. (A) Map of R-loop peaks on Chromosome 1. Diagram of Chromosome 1 with the pericentromeres shaded in black (top). The x-axis represents positions on Chromosome 1. The y-axis represents numbers of R-loop peaks. See Supplemental Figure S6, for the other chromosomes. Shown below are patterns of genes expressed in the leaf (yellow, genes/1Mb), TEs (DNA-TE/1Mb, dark yellow; RNA-TEs/1Mb, dark blue), histone modification (H3K9me2 [purple, log2{ChIP/input}], H3K56ac [light blue, log2{ChIP/input}]), DNA methylation (proportion methylated in CG [orange], CHG [gray], and CHH [dark blue] contexts/500-kb). (B) R-loops (green) and CRM1 (red) were costained on pachytene stage chromosomes. RNase H-treatment abolishes the R-loop signals on the pachytene chromosomes. The dashed line indicates the section of chromatin used for quantifying signal intensity. Scale bar = 10 μm. (C) Fluorescent profiles indicates that R-loops mainly localized to both sides of the CRM1 signals. Twelve axis sections of 100 pixels centered on pericentromeric heterochromatin were used to quantify signal intensity.

