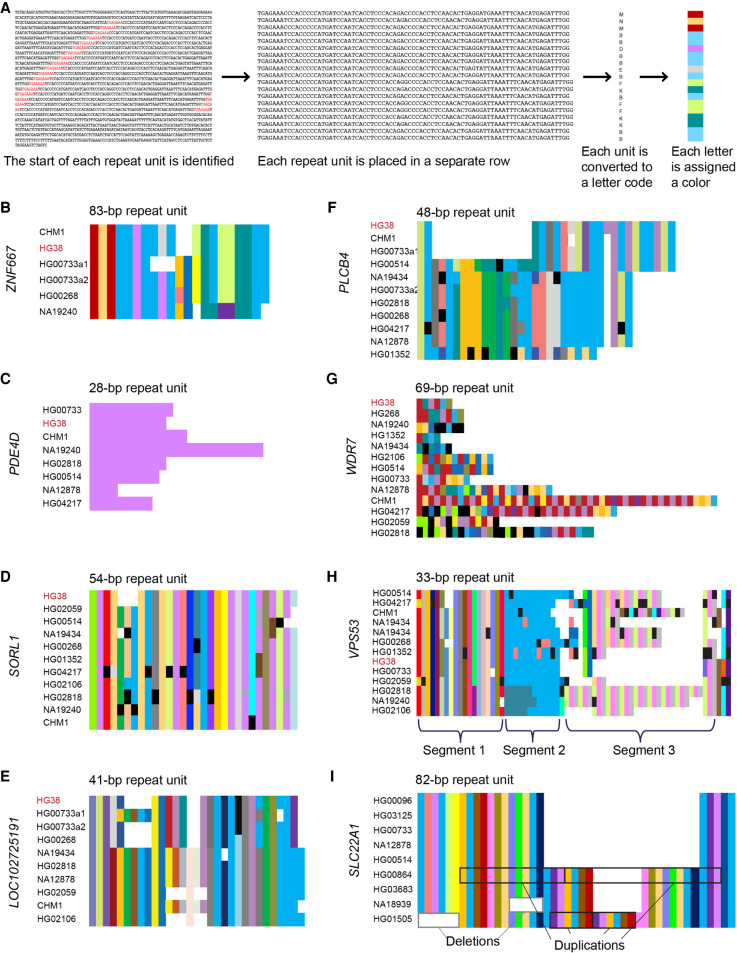
Figure 3.
Composition plots illustrating modes of variability in VNTRs. (A) Schematic overview of how composition plots are generated from long-read sequencing. Example is from the CHM1 genome for the VNTR in ZNF667. (B–H) Composition plots showing varying patterns in example VNTRs: (B) ZNF667, (C) PDE4D, (D) SORL1, (E) LOC102725191, (F) PLCB4, (G) WDR7, (H) VPS53. At the left of each plot are listed the genomes from which the allele has been obtained, which were previously sequenced and published, and which represent geographically diverse populations (Audano et al. 2019). Different alleles from the same individual are denoted with “a1” and “a2.” At the top of each plot is the motif length given by Tandem Repeats Finder, which can vary in length by one or more bases depending on insertions or deletions in each motif. Black segments in the plots denote motifs with private variants. (I) Composition plot for the VNTR in SLC22A1, with examples of duplication and deletion boxed in black and gray, respectively. The genomes used for this plot were previously sequenced and published (Ebert et al. 2021).

