
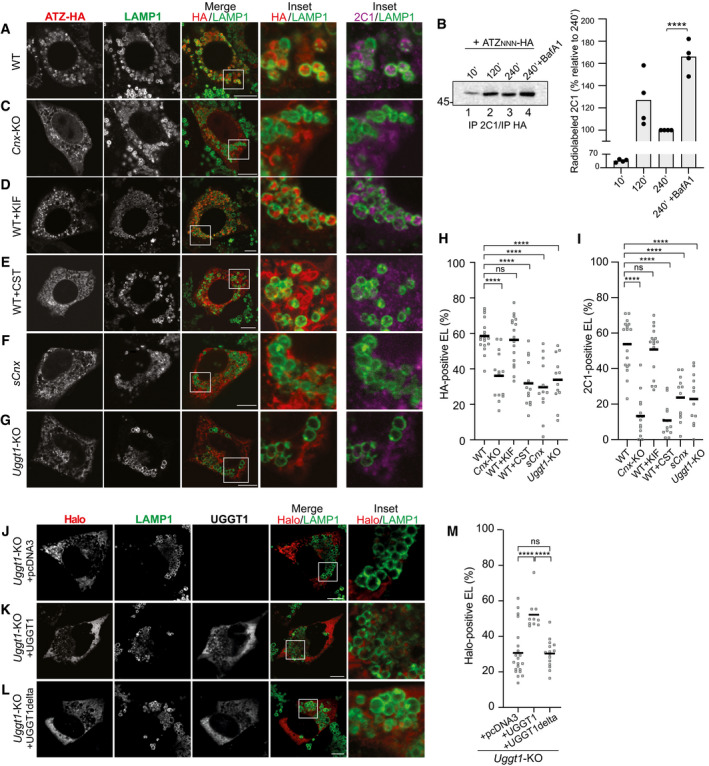
Figure 2. Role of CNX and of N‐glycan processing in delivery of ATZNNN to the endolysosomes.
-
AConfocal laser scanning microscopy analyses in cells treated with BafA1. Total ATZNNN‐HA (red) or ATZNNN polymers (magenta) in LAMP1‐positive endolysosome (green) in WT MEF.
-
BRadiolabeled ATZNNN enters in 2C1‐positive polymers that are immunoisolated at the end of the chase times. BafA1 inhibits polymers degradation. Quantification for n = 4. Unpaired two‐tailed t‐test, ****P < 0.0001.
-
CSame as (A) in Cnx‐KO MEF.
-
DSame as (A) in WT MEF exposed to kifunensine (KIF).
-
ESame as (A) in WT MEF exposed to Castanospermine (CST).
-
FSame as (A) in sCNX MEF.
-
GSame as (A) in Uggt1‐KO MEF.
-
H, I(H) Quantification of HA‐positive or (I) of 2C1‐positive endolysosomes (mean, n = 18, 14, 17, 13, 12, 12 cells for panels (A, C–G), respectively). One‐way ANOVA and Dunnett’s multiple comparison test, ns P > 0.05, ****P < 0.0001.
-
JHalo‐ATZNNN in Uggt1‐KO MEF mock‐transfected (empty pcDNA3 plasmid).
-
K, L(K) Same as (J), with a plasmid for expression of active or (L) inactive UGGT1.
-
MQuantification of Halo‐ATZNNN‐positive endolysosomes (mean, n = 22, 10, 15 cells for panels (J–L), respectively). One‐way ANOVA and Dunnett’s multiple comparison test, ns P > 0.05, ****P < 0.0001.
Data information: Scale bars 10 μm.
Source data are available online for this figure.