
Figure 4.
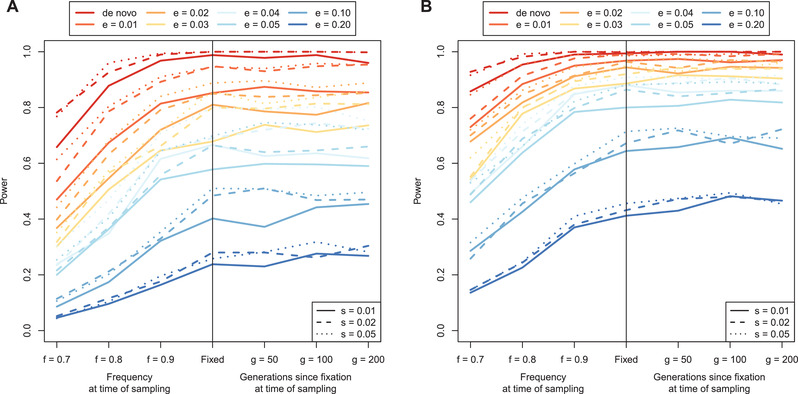
Power curves for (A) the max‐score approach and (B) the window‐based approach to identifying sweeps. The parameters are e (frequency at which selection begins, e > 0 indicates soft sweep), f (frequency of selected mutation at sampling), g (number of generations since fixation), and s (selection coefficient).