
Figure 5.
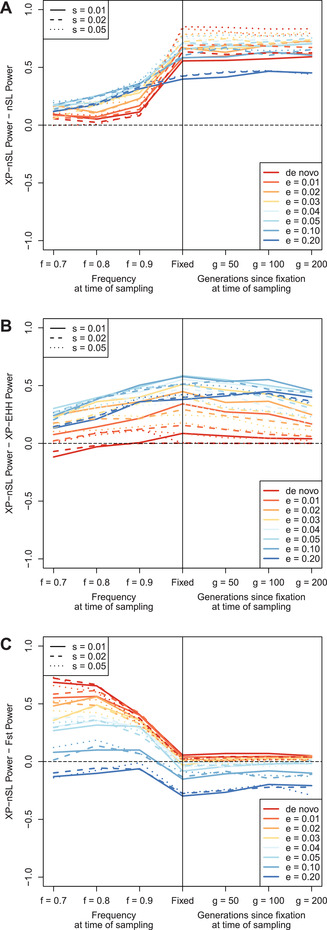
Difference in power between XP‐nSL and (A) nSL, (B) XP‐EHH, and (C) FST. Values above 0 indicate XP‐nSL has more power, and values below 0 indicate XP‐nSL has less power. The horizontal black dotted line marks 0. The parameters are e (frequency at which selection begins, e > 0 indicates soft sweep), f (frequency of selected mutation at sampling), g (number of generations since fixation), and s (selection coefficient).