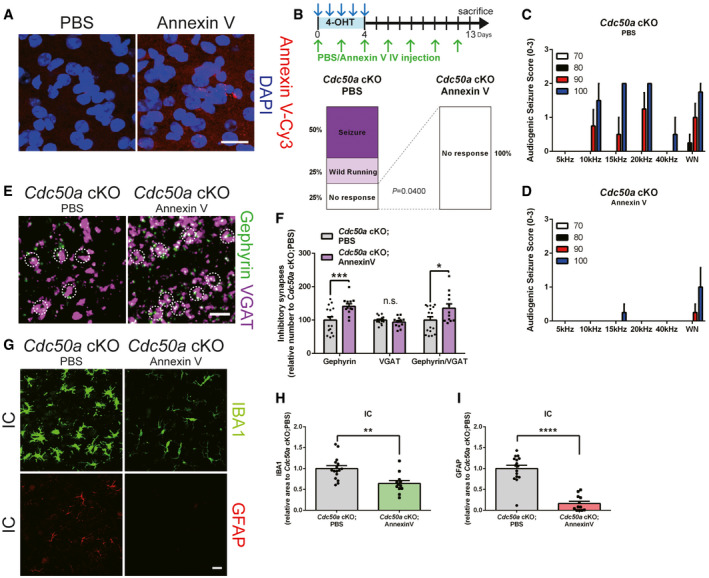
Figure EV4. PS exposure is necessary for glial activation and inhibitory post‐synapse loss in Cdc50a cKO mice.

-
ARepresentative confocal z‐stack images for Annexin V (red) and DAPI (magenta) in the IC (inferior colliculus) of PBS‐ or Annexin V‐Cy3‐injected wild‐type mice. Scale bar, 20 μm.
-
BSchematic diagram of the experiment in which Annexin V was intravenously injected (every 2 days) to block PS in Cdc50a cKO mice. Bar graphs showing the audiogenic seizure scores of in PBS‐ or Annexin V‐injected Cdc50a cKO mice after a 20 kHz/90 dB auditory stimulus (n = 5 for each group).
-
C, DBar graphs showing audiogenic seizure scores following auditory stimuli (5, 10, 15, 20, 40 kHz or white noise (WN) at 70, 80, 90, or 100 dB) in PBS‐ (C) or Annexin V‐ (D) injected Cdc50a cKO mice (n = 5 for each group).
-
ERepresentative confocal z‐stack images for Gephyrin (green)‐ and VGAT (magenta)‐positive inhibitory synapses in the IC of PBS‐ or Annexin V‐injected Cdc50a cKO mice. The white circles indicate inhibitory synapses. Scale bar, 10 μm.
-
FBar graphs showing the number of inhibitory (Gephyrin‐ and VGAT‐positive) synapses in the IC of PBS‐ or Annexin V‐injected Cdc50a cKO mice (n = 3 for each group, P*** = 0.0004, P* = 0.0347, n.s., not significant).
-
GRepresentative confocal z‐stack images showing reactive microglia (IBA1, green) and astrocytes (GFAP, red) in the IC of PBS‐ or Annexin V‐injected Cdc50a cKO mice. Scale bar, 20 μm.
-
H, IBar graphs showing the relative area of IBA1‐ (H) and GFAP‐ (I) positive cells in the IC (inferior colliculus) of PBS‐ or Annexin V‐injected Cdc50a cKO mice (n = 3 for each group, **P = 0.0014, ****P < 0.0001).
Data information: The individual dots indicate experimental replicates (3–5 images were taken from 2 brain slices per an animal, F, H, and I). The data are the mean ± SEM and were analyzed by two‐tailed unpaired t‐test.
