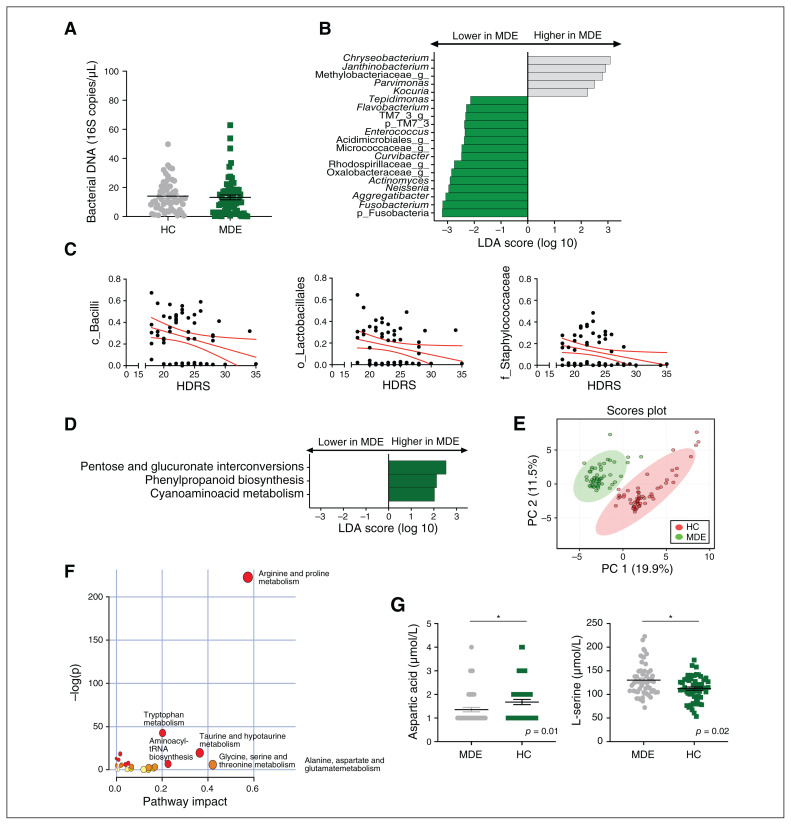
Fig. 1.
Blood microbiota and metabolomic profiles of patients with a major depressive episode (green; n = 56) and matched healthy controls (grey; n = 56). (A) Bacterial 16S rDNA assessed by quantitative polymerase chain reaction in healthy controls and patients with a major depressive episode (p = 0.3, unpaired Mann–Whitney test). (B) LDA effect size for the taxa enriched in patients with a major depressive episode and healthy controls. (C) Correlations between HDRS score and baseline relative abundance of Bacilli, Lactobacillales and Staphylococcaceae (Spearman correlation, p < 0.05 after FDR correction for multiple comparisons). (D) LDA effect size for the predicted metagenome metabolic pathways (KEGG modules) for patients with a major depressive episode versus healthy controls. Only taxa with an LDA score greater than 2 and p < 0.05 (determined by Wilcoxon signed rank test) are shown. (E) PCA score plots of the metabolomic profiles of healthy controls and patients with a major depressive episode. (F) Summary of the pathway analysis using MetaboAnalyst 2.0, which shows all matched pathways according to the p values from the pathway enrichment analysis and pathway impact values from the pathway topology analysis. (G) Absolute plasma concentrations of the metabolites aspartic acid and L-serine; *p < 0.05. FDR = false discovery rate; HC = healthy control; HDRS = Hamilton Depression Rating Scale; KEGG = Kyoto Encyclopedia of Genes and Genomes; LDA = linear discriminant analysis; MDE = major depressive episode; PC = principal component; PCA = principal component analysis.

