Fig. 3.
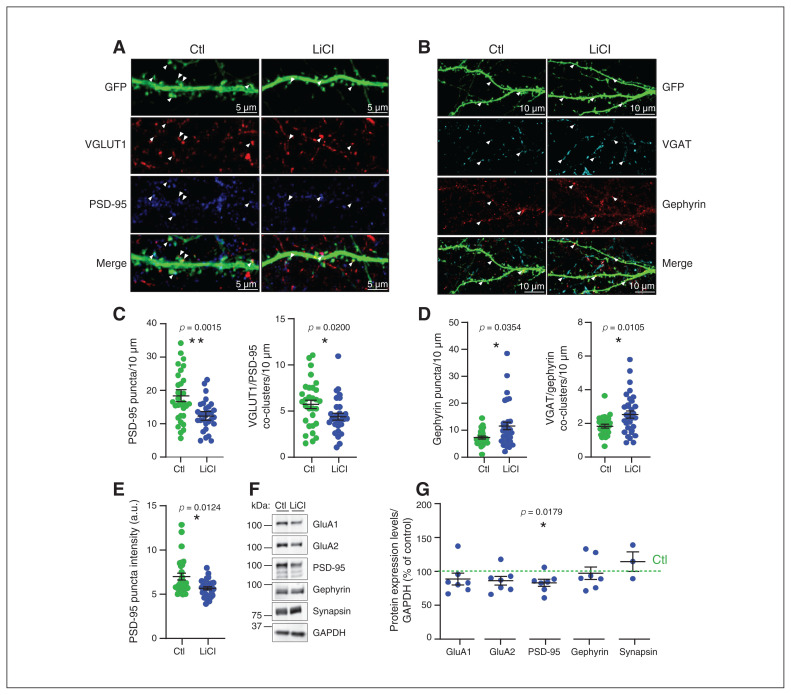
Chronic lithium treatment induced excitatory and inhibitory synaptic changes. (A) Representative confocal image of dendrites expressing free GFP from neurons treated with lithium (LiCl 1.5 mM) for 7 days or not treated (Ctl), with antibodies directed against VGAT and gephyrin. Arrowheads show the VGAT and gephyrin puncta localization and the colocalization between VGAT and gephyrin in the merge, indicating the inhibitory synapses. Bar 10 μm. (B) Scatter plots show quantification of gephyrin puncta density/10 μm and VGAT/gephyrin co-cluster density representing the density of inhibitory synapses per 10 μm from secondary or tertiary dendrites from neurons that were treated with lithium (LiCl 1.5 mM) for 7 days or not treated (Ctl); n = 32 neurons per condition from 3 separate experiments. (C) Representative confocal image of dendrites expressing free GFP from neurons treated with lithium (LiCl 1.5 mM) for 7 days or not treated (Ctl), with antibodies directed against VGLUT1 and PSD-95. Arrowheads show the VGLUT1 and PSD-95 puncta localization and the colocalization between VGLUT1 and PSD-95 in the merge, indicating the excitatory synapses. Bar 5 μm. (D) Scatter plots show quantification of PSD-95 puncta density/10 μm and VGLUT1/PSD-95 co-cluster density representing the density of excitatory synapses per 10 μm from secondary and tertiary dendrites, as well as (E) PSD-95 puncta intensity from neurons treated with lithium (LiCl 1.5 mM) for 7 days or not treated (Ctl); n = 30 neurons per condition from 3 separate experiments. Data shown in B to E are mean ± standard error of the mean. Statistical significance was determined using a nonparametric Mann–Whitney test. (F) Representative immunoblots for GluA1, GluA2, PSD-95, gephyrin, synapsin1 and GAPDH of neuronal extract (18 days in vitro) from neurons treated with lithium (LiCl 1.5 mM) for 7 days or not treated (Ctl). (G) Quantification with scatter plot of some pre- and postsynaptic protein expression levels normalized with GAPDH (represented as percent of control) of neuronal extract (18 days in vitro) from neurons treated with lithium (LiCl 1.5 mM) for 7 days or not treated (Ctl) from 3 to 7 separate experiments. Data are mean ± standard error of the mean. Statistical significance was determined using a 1-sample t test with a hypothetical value of 100 for controls. Ctl = control; GAPDH = glyceraldehyde 3-phosphate dehydrogenase; GFP = green fluourescent protein; LiCl = lithium chloride; VGAT = vesicular γ-aminobutyric acid transporter; VGLUT1 = vesicular glutamate transporter 1.

