Fig. 4.
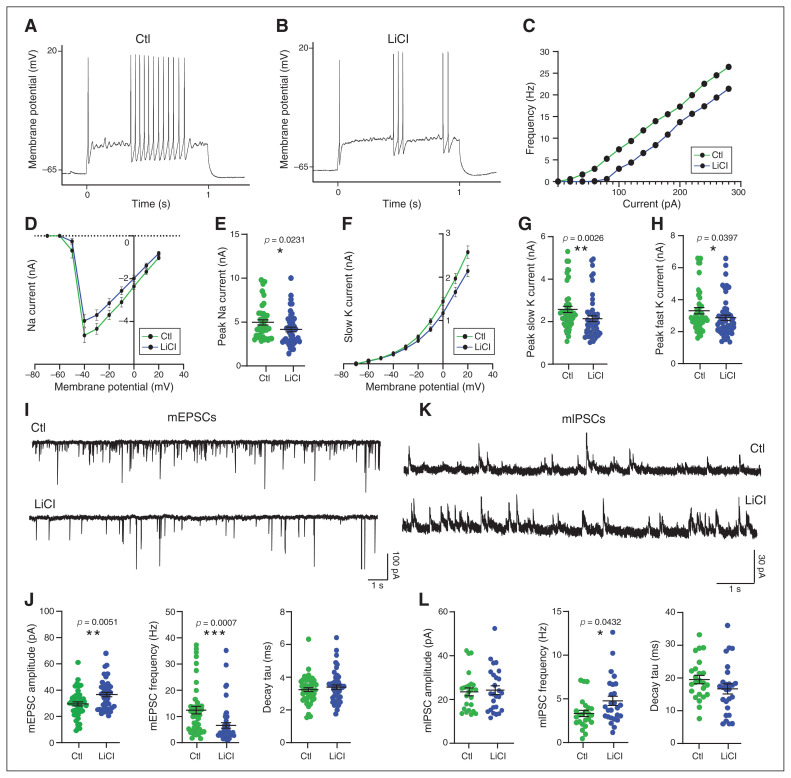
Chronic lithium treatment reduced neuronal excitability and excitatory transmission, and it increased inhibitory synaptic transmission. Representative action potential trains in (A) control and (B) chronically treated (LiCl 1.5 mM) neurons at 18 days in vitro, in response to a 1 s depolarizing 120 pA current step from approximately −65 mV. (C) Frequency–current plot among repetitively firing neurons. Frequency represents the mean number of spikes per second from approximately 32 neurons per condition from 4 independent experiments. (D) Voltage dependence of the amplitude of the sodium current. (E) Quantification of the peak amplitude of sodium currents in neurons treated with lithium (LiCl 1.5 mM) for 7 days or not treated (Ctl). (F) Voltage dependence of the amplitude of the slow potassium current. (G and H) Quantification of the peak amplitude of the slow and fast potassium currents in neurons treated with lithium (LiCl 1.5 mM) for 7 days or not treated (Ctl). The data from D to H are from 5 separate experiments and are mean ± standard error of the mean. Statistical significance was determined by nonparametric Mann–Whitney tests. (I) Representative sample traces of mEPSCs from neurons treated with lithium (LiCl 1.5 mM) for 7 days or not treated (Ctl). Scale bar shown as inset. (J) Scatter plots show quantification of amplitude, frequency and decay tau for mEPSCs of approximately 45 neurons from 4 independent experiments. (K) Representative sample traces of mIPSCs from neurons treated or not with LiCl (1.5 mM) for 7 days. Scale bar shown as inset. (L) Scatter plots show quantification of amplitude, frequency and decay tau for mIPSCs of approximately 26 neurons from 3 independent experiments. Data from J and L are mean ± standard error of the mean. Statistical significance was determined by nonparametric Mann–Whitney tests. Ctl = control; LiCl = lithium chloride; mEPSC = miniature excitatory postsynaptic current; mIPSC = miniature inhibitory postsynaptic current.

