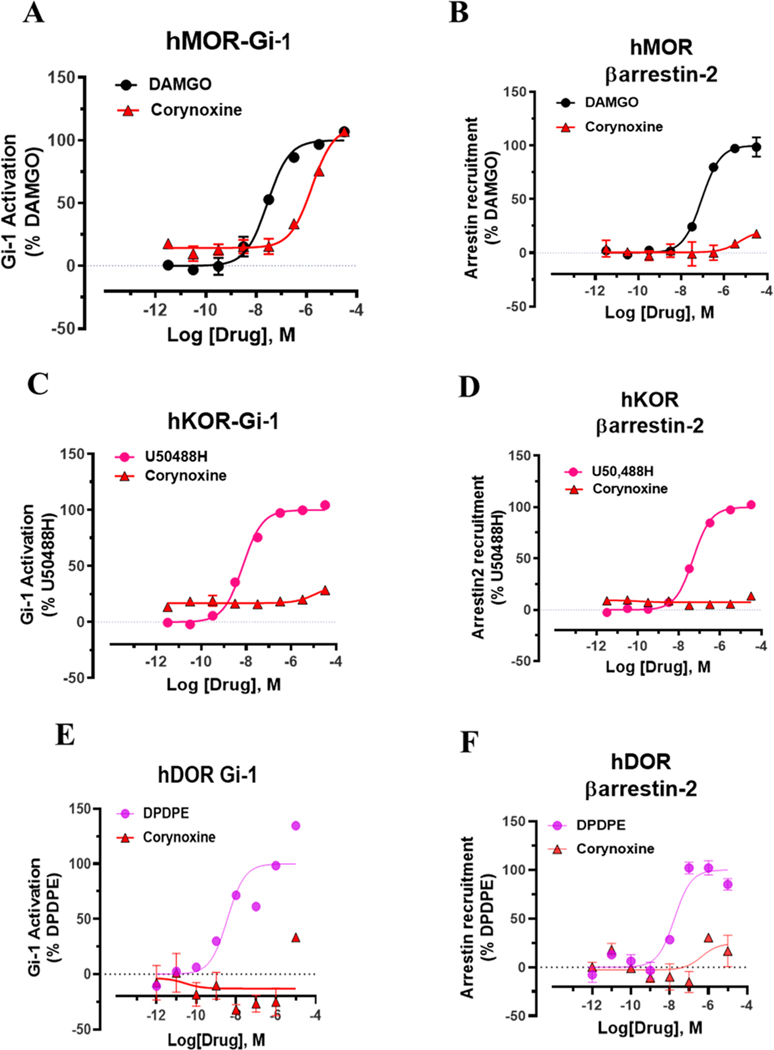
Figure 3.
G-protein and βarrestin-2 signaling of corynoxine at opioid receptors. Corynoxine shows MOR selective G-protein signaling while not recruiting βarrestin-2. (A) Gi-1 activation measured using BRET assays at hMOR. Corynoxine is a full agonist at hMOR compared to DAMGO. DAMGO EC50 (nM) (pEC50 ± SEM) = 28.12 (7.55 ± 0.08) nM, Emax% ± SEM = 100 ± 2.78. Corynoxine EC50 (nM) (pEC50 ± SEM) = 1630 (5.79 ± 0.09) nM, Emax% ± SEM = 96.54 ± 4.69. (B) No measurable βarrestin-2 recruitment was observed in BRET assays of corynoxine at hMOR. DAMGO EC50 (nM) (pEC50 ± SEM) = 90.6 (7.04 ± 0.07) nM, Emax% ± SEM = 100 ± 2.29. Corynoxine EC50 (nM) (pEC50 ± SEM) = n.d. Emax% ± SEM < 20%. (C) Gi-1 activation measured using BRET assays at hKOR. U50488H EC50 (nM) (pEC50 ± SEM) = 6.93 (8.16 ± 0.06) nM, Emax% ± SEM = 100 ± 1.61. Corynoxine EC50 (nM) (pEC50 ± SEM) = n.d. Emax% ± SEM < 20%. (D) No measurable βarrestin-2 recruitment was observed in BRET assays of corynoxine at hKOR. U50488H EC50 (nM) (pEC50 ± SEM) = 48.95 (7.31 ± 0.04) nM, Emax% ± SEM = 100 ± 1.47. Corynoxine EC50 (nM) (pEC50 ± SEM) = n.d., Emax% ± SEM < 20. (E) Gi-1 activation measured using BRET assays at hDOR. DPDPE EC50 (nM) (pEC50 ± SEM) = 3.65 (8.43 ± 0.37) nM, Emax% ± SEM = 100 ± 14.51. Corynoxine EC50 (nM) (pEC50 ± SEM) = n.d. Emax% ± SEM < 20%. (F) No measurable βarrestin-2 recruitment was observed in BRET assays of corynoxine at hDOR. DPDPE EC50 (nM) (pEC50 ± SEM) = 17.69 (7.75 ± 0.17) nM, Emax% ± SEM = 100 ± 5.8. Corynoxine EC50 (nM) (pEC50 ± SEM) = n.d., Emax% ± SEM < 20. n.d. = not determined. Data from both Gi-1 activation and βarrestin-2 assays using human opioid receptors were normalized to Emax of the corresponding controls, DAMGO, U50,488H, and DPDPE. The data were processed in GraphPad Prism using a three-parameter logistic equation to fit the dose response curves. Mean EC50 (pEC50 ± SEM) represents the data for assays run in triplicate (n = 3). See Table S1 for values.

