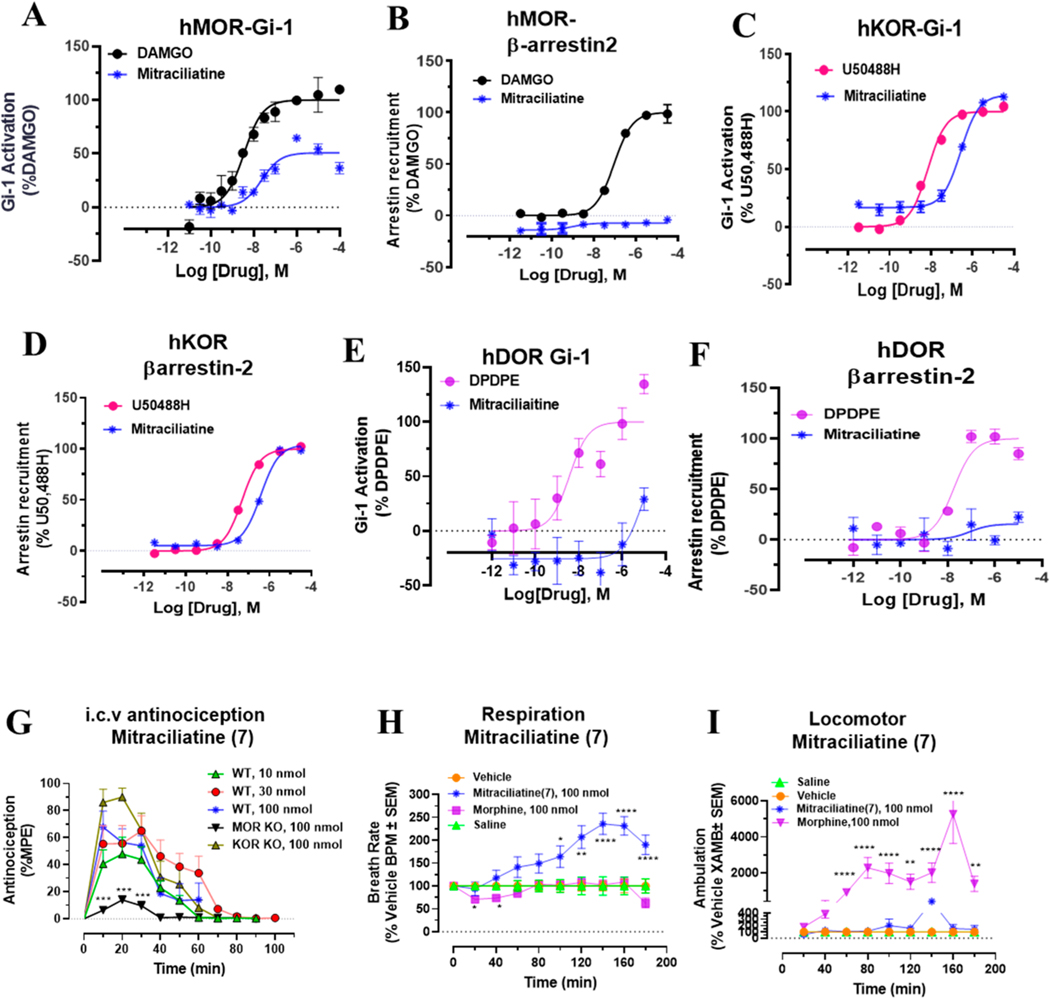
Figure 5.
G-protein and βarrestin-2 signaling, antinociception time course, respiratory depression, and locomotor effects of mitraciliatine. Mitraciliatine shows agonism at hMOR and hKOR while showing differential βarrestin-2 signaling at the same subtypes. Mitraciliatine shows MOR dependent antinociception. Attenuated respiratory depression and locomotor effects were observed for mitraciliatine at equianalgesic morphine doses. (A) Gi-1 activation measured using BRET assays at hMOR. Mitracilliatine shows G-protein signaling at hMOR while showing no βarrestin-2 signaling, compared to DAMGO. DAMGO EC50 (nM) (pEC50 ± SEM) = 3.56 (8.45 ± 0.13) nM, Emax% ± SEM = 100 ± 4.17. Mitraciliatine EC50 (nM) (pEC50 ± SEM) = 23.69 (7.62 ± 0.16) nM, Emax% ± SEM = 50.7 ± 3.22. (B) No measurable βarrestin-2 recruitment was observed in BRET assays of mitracilatine at hMOR. DAMGO EC50 (nM) (pEC50 ± SEM) = 90.6 (7.04 ± 0.07) nM, Emax% ± SEM = 100 ± 2.29. Mitraciliatine EC50 (nM) (pEC50 ± SEM) = n.d., Emax% ± SEM < 20. (C) Gi-1 activation measured using BRET assays at hKOR. Mitracilliatine shows G-protein signaling at hKOR as well as robust βarrestin-2 signaling at hKOR. U50488H EC50 (nM) (pEC50 ± SEM) = 6.93 (8.16 ± 0.06) nM, Emax% ± SEM = 100 ± 1.61. Mitraciliatine EC50 (nM) (pEC50 ± SEM) = 269.19 (6.57 ± 0.06) nM, Emax% ± SEM = 114.32 ± 2.42. (D) Significant βarrestin-2 recruitment was observed in BRET assays of mitracilatine at hKOR. U50488H EC50 (nM) (pEC50 ± SEM) = 48.95 (7.31 ± 0.04) nM, Emax% ± SEM = 100 ± 1.47. Mitraciliatine EC50 (nM) (pEC50 ± SEM) = 383.12 (6.42 ± 0.06) nM, Emax% ± SEM = 104.13 ± 2.57. (E) Gi-1 activation measured using BRET assays at hDOR. Mitraciliatine did not show G-protein or βarrestin-2 signaling at hDOR. DPDPE EC50 (nM) (pEC50 ± SEM) = 3.65 (8.43 ± 0.37) nM, Emax% ± SEM = 100 ± 14.54. Mitraciliatine EC50 (nM) (pEC50 ± SEM) = n.d., Emax% ± SEM = n.d. (F) No measurable βarrestin-2 recruitment was observed in BRET assays of mitracilatine at hDOR. DPDPE EC50 (nM) (pEC50 ± SEM) = 17.69 (7.75 ± 0.17) nM, Emax% ± SEM = 100 ± 5.8. Mitraciliatine EC50 (nM) (pEC50 ± SEM) = n.d., Emax% ± SEM < 20. n.d. = not determined. Data from both Gi-1 activation and βarrestin-2 assays using human opioid receptors were normalized to Emax of the corresponding controls, DAMGO, U50,488H, and DPDPE. The data were processed in GraphPad Prism using a three-parameter logistic equation to fit the dose response curves. Mean EC50 (pEC50 ± SEM) represents the data for assays run in triplicate (n = 3). See Table S1 for values. (G) Antinociception time course of mitraciliatine: Groups of C57BL/6J mice (n = 8 each group) received (i.c.v.) mitraciliatine, and antinociceptive response was evaluated at doses of 10, 30, and 100 nmol in WT mice at the indicated time points using the 55 °C tail withdrawal assay. Each point represents mean% antinociception ± SEM. We observed potent dose dependent antinociceptive response of mitraciliatine. Antinociception effect of mitraciliatine (100 nmol, i.c.v.) remained intact in KOR KO mice, although a statistically not significant increase in %MPE was seen. Antinociception was found attenuated in MOR KO mice at 10–30 min (***p = 0.0001, 0.001, and 0.0001 at 10, 20, and 30 min, respectively, unpaired t test per row corrected for multiple comparisons using Holm-Sidak method). (H) Respiratory rate mitraciliatine: Groups of mice received either vehicle (n = 12), saline (n = 12), morphine (100 nmol, i.c.v.; n = 12), or mitraciliatine (100 nmol, i.c.v.; n = 12), and the measurement of breath rates was done every 20 min for 180 min. Mitraciliatine showed increase in breath rates at 100 min (*p = 0.0233), 120 min (**p = 0.0017), and 140–180 min (****p < 0.0001) compared to vehicle, while morphine decreased breadth rates at 20–40 min (*p = 0.0387). The p values were calculated by 2-way ANOVA followed by Dunnett’s multiple-comparison test. (I) Locomotor effect mitraciliatine: Groups of mice received either vehicle (n = 24), saline (n = 12), morphine (100 nmol, i.c.v.; n = 12), or mitraciliatine (100 nmol, i.c.v.; n = 12), and the distance traveled by charcoal for each group of mice was measured. Mitraciliatine showed no significant hyperlocomotion compared to that of the vehicle as determined by 2-way ANOVA followed by Dunnett’s multiple-comparison test. However, significant locomotor effect was observed for morphine at 80–100 min (****p < 0.0001), 120 min (**p = 0.0038), 140–160 min (****p < 0.0001), and 180 min (**p = 0.0093) compared to that of the vehicle. The p values were calculated by 2-way ANOVA followed by Dunnett’s multiple-comparison test.

