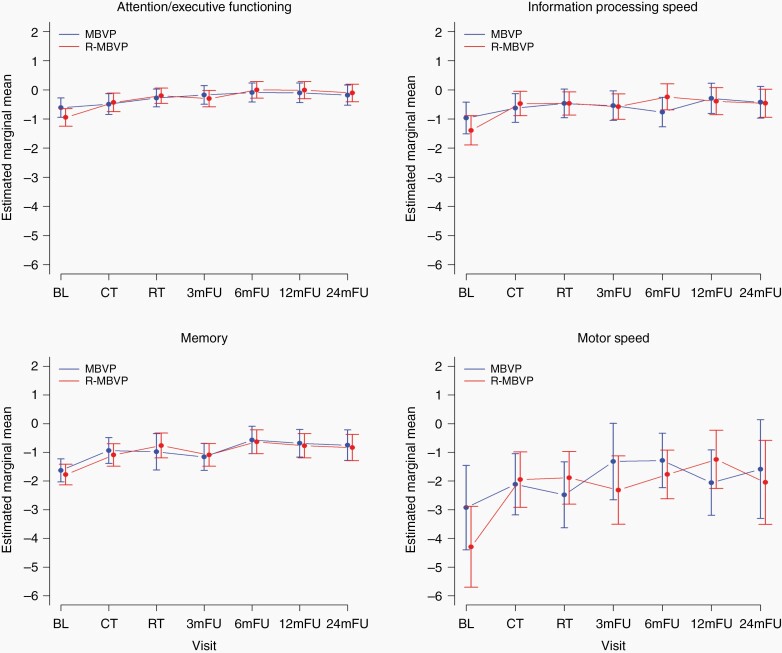
Fig. 2.
Mean z-scores for the different neurocognitive domains over time (A: attention/executive functioning; B: information processing speed; C: memory; D: motor speed), separately for the treatment arms. Estimated marginal means for each evaluation point separately for each treatment arm, with the vertical bars representing the 95% confidence interval of the group mean.

