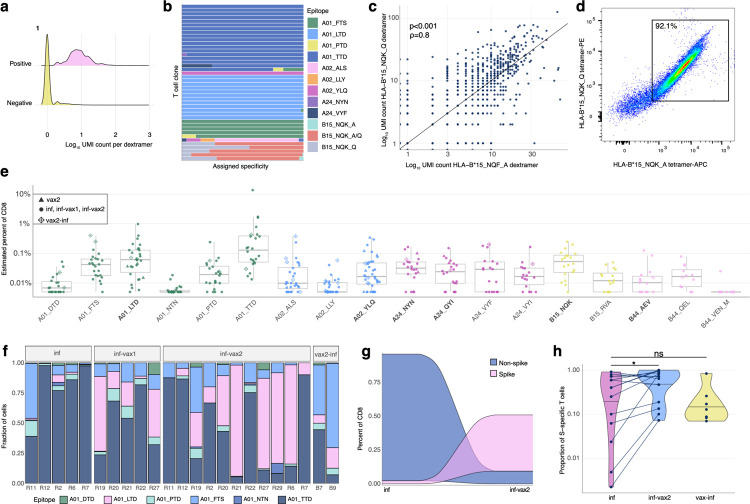
Figure 2. Magnitude, dynamics, and cross-reactivity of CD8+ epitope-specific responses after diverse SARS-CoV-2 exposures.
a. Antigen specificity of each T cell inferred from dextramer-barcode UMI counts. Representative distribution of the number of UMIs in cells called dextramer-positive (pink) and dextramer-negative (yellow). b. T cells within a clone have largely consistent specificity assignments, except T cells that cross-react with common cold coronavirus epitopes (B15_NQK_A/B15_NQK_Q pair). Each bar shows a fraction of cells of a given clonotype attributed to different dextramers. The 43 most abundant clones (more than 20 cells) are shown. c. The correlation between the number of UMIs for B15_NQK_Q (SARS-CoV-2) and B15_NQK_A (OC43 and HKU1) dextramers (Spearman ρ=0.8, p<0.001). d. Cross-reactivity between HLA-B*15:01-NQK epitope variants confirmed in vitro. Jurkat cell line expressing αβTCR identified from scTCRseq data binds pMHC multimers loaded with both SARS-CoV-2 and CCCoV variants of the epitope. e. The magnitude of epitope-specific CD8+ T cell responses. Each point depicts an estimated frequency of epitope-specific T cells in a sample. Estimated frequency was calculated as a fraction of dextramer-specific T cells in scRNAseq results multiplied by bulk frequency of dextramer-stained CD8+ cells of all CD8+ cells measured by flow cytometry. Central line on boxplot shows the median. Epitopes from spike protein are in bold font. f. Composition of HLA-A*01-restricted T cell response in HLA-A*01 positive donors. Increasing proportion of spike-targeting T cells (pink) is observed after vaccination of infected individuals. g. Boosting of spike-specific epitope fraction after vaccination (donor R6). h. Previously infected individuals have a higher proportion of spike-specific T cells after vaccination than before vaccination (p=0.025, one-sided Wilcoxon signed-rank test). Spike T cell proportion (shown on a log10-scale) was calculated as a fraction of spike-specific T cells out of all CD8+ epitope-specific T cells of a donor in scRNAseq data. Central line on the violin shows the median.

