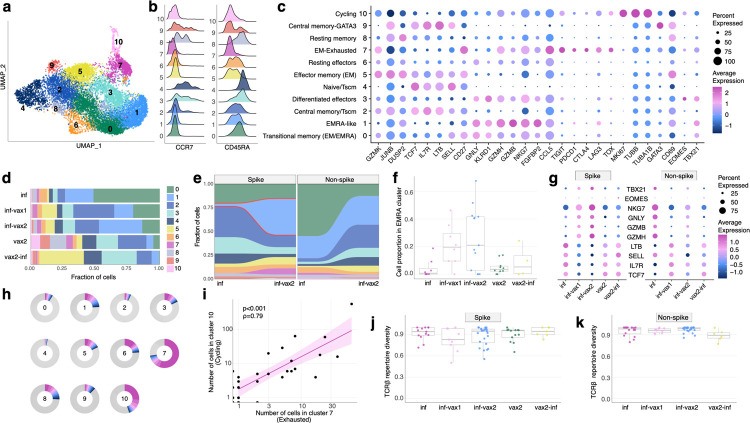
Figure 3. Phenotypic diversity of epitope-specific CD8+ T cells after diverse SARS-CoV-2 exposures.
a. UMAP (Uniform manifold approximation and projection) of all SARS-CoV-2 epitope-specific CD8 T cells based on gene expression (GEX). Color shows results of graph-based unsupervised clustering performed with the Seurat package. b. Density plot of CCR7 and CD45RA surface expression (measured by CITE-seq) in GEX clusters. c. Bubble plot of representative differentially expressed genes for each cluster. Size of the circle shows percentage of cells in a cluster expressing a certain gene, color scale shows gene expression level. d. Distribution of epitope-specific T cells in gene expression clusters between study groups. e. Proportion of spike-specific T cells is significantly increased in cluster 1 after vaccination of previously infected individuals, compared to the pre-vaccination timepoint (p<0.0001, Fisher exact test). f. Proportion of spike-specific cells in EMRA (cluster 1) across study groups for samples with more than ten spike-specific cells (Kruskal-Wallis H test p=0.028). Central line on boxplot shows the median. g. Expression of classical cytotoxic and memory markers across study groups and T cell specificities. Size of the circle shows percentage of cells in a cluster expressing a certain gene, color scale shows gene expression level. h. Clone size distribution within GEX clusters. Fractions of cells from 10 most abundant clonotypes in each cluster are shown with colors, all other clonotypes are shown in grey. i. Number of cells in cluster 7 (Exhausted) and cluster 10 (Cycling) in samples are strongly correlated (Spearman ρ=0.79, p<0.001). Shaded area shows 95% confidence interval for linear fit. j-k. T cell repertoire diversity of spike (j) and non-spike specific repertoires across study groups (p=0.63 for spike, p=0.17 for non-spike, Kruskal-Wallis H test). Normalized Shannon entropy of TCRβ is plotted for samples with more than 3 unique TCRβ clonotypes. Central line on boxplot shows the median.

