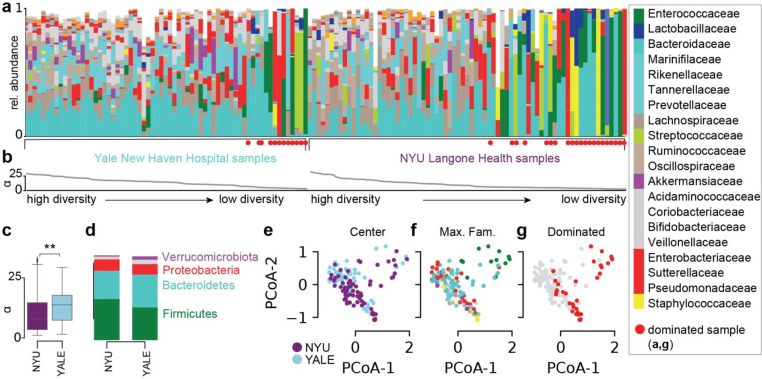
Figure 2. Gut microbiome bacterial compositions during COVID-19 in patients from NYU Langone Health and Yale New Haven Hospital.
a Bacterial family composition in stool samples identified by 16S rRNA gene sequencing; bars represent the relative abundances of bacterial families; red circles indicate samples with single taxa >50%. Samples are sorted by the bacterial α-diversity (inverse Simpson index, b). c α-diversity in samples from NYU Langone Health and Yale New Haven Hospital. d Average phylum level composition per center. e-g Principal coordinate plots of all samples shown in a, labeled by center (e), most abundant bacterial family (f) and domination status of the sample (g).

