. 2021 Apr 21;3(4):e200184. doi: 10.1148/ryai.2021200184

Figure 2:

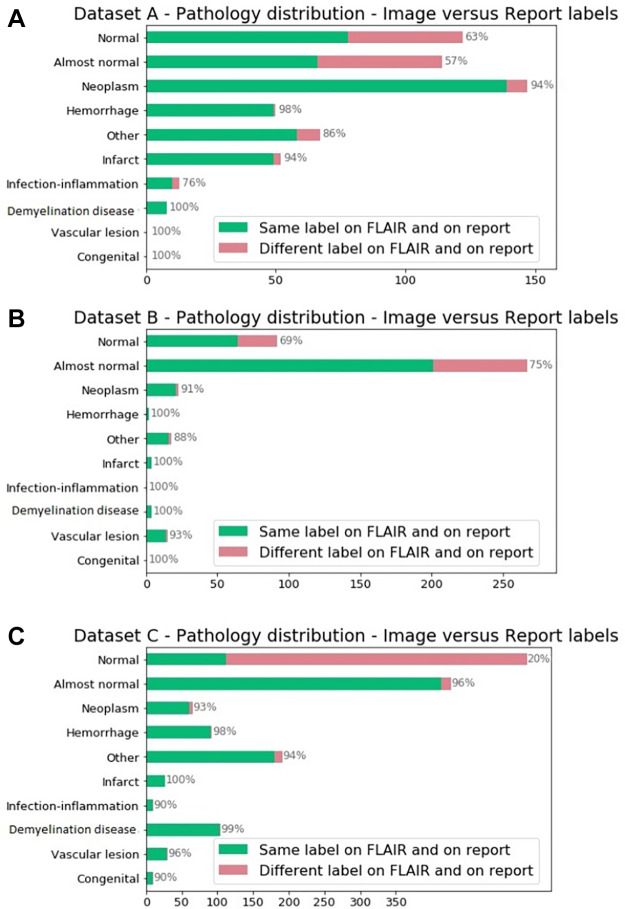
Pathologic distribution on (A) dataset A, (B) dataset B, and (C) dataset C identified by using annotations from the report. Reported in green are the percentage of annotations in which labels derived from the fluid-attenuated inversion recovery (FLAIR) MR image alone matched the report labels. Note on imaging that “almost normal” and other pathologic conditions are classified as “likely abnormal.”

Pathologic distribution on (A) dataset A, (B) dataset B, and (C) dataset C identified by using annotations from the report. Reported in green are the percentage of annotations in which labels derived from the fluid-attenuated inversion recovery (FLAIR) MR image alone matched the report labels. Note on imaging that “almost normal” and other pathologic conditions are classified as “likely abnormal.”