. 2021 Apr 21;3(4):e200184. doi: 10.1148/ryai.2021200184

Figure 3:

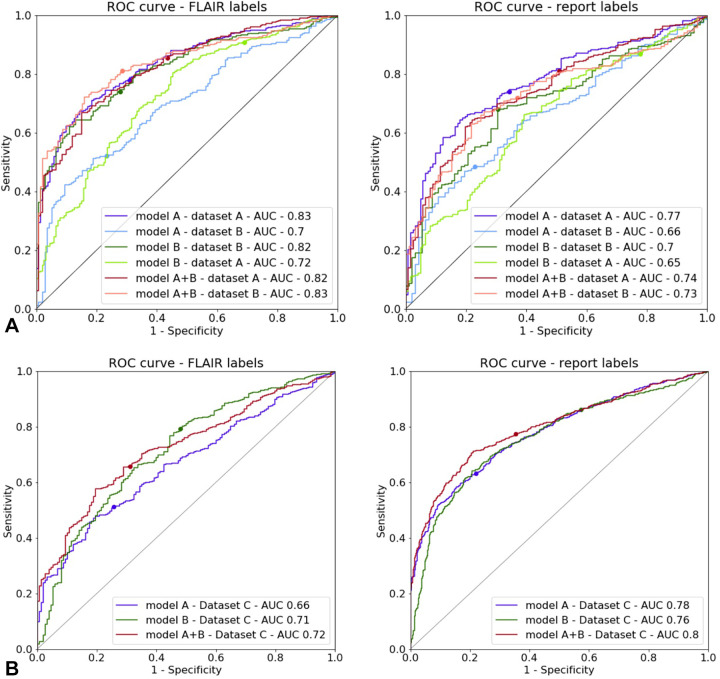
Receiver operating characteristic (ROC) curves for models A, B, and A + B on (A) the testing subset of dataset A and the testing subset of dataset B, as well as on (B) the testing dataset C. Annotation labels from fluid-attenuated inversion recovery (FLAIR) (left) and radiology report annotation labels (right) were used as ground truths. The dots show the values corresponding to a threshold of .5. AUC = area under the ROC.

Receiver operating characteristic (ROC) curves for models A, B, and A + B on (A) the testing subset of dataset A and the testing subset of dataset B, as well as on (B) the testing dataset C. Annotation labels from fluid-attenuated inversion recovery (FLAIR) (left) and radiology report annotation labels (right) were used as ground truths. The dots show the values corresponding to a threshold of .5. AUC = area under the ROC.