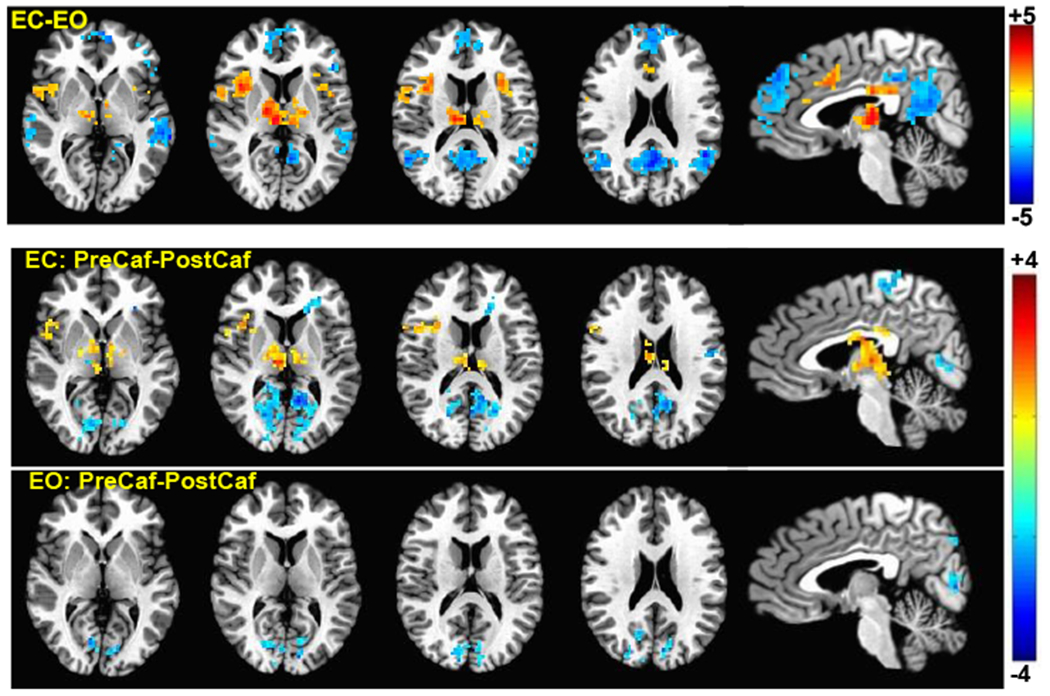
Figure 3:

Group result z-scores (from 3ttest++) showing areas of significant difference between the vigilance correlation maps derived from different sessions. The top row shows the ECnonCaf minus EOnonCaf map (p < 0.05, corrected). The middle and the bottom rows display preCaf minus postCaf for eyes-closed and eyes-open conditions, respectively (p < 0.05 uncorrected).
