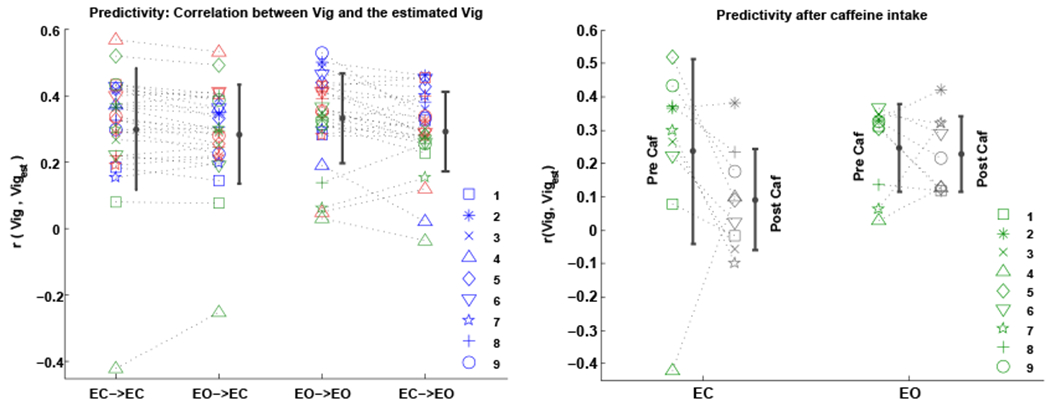
Figure 4:

Predictivity: correlation between the EEG-based vigilance time series and the estimated vigilance using matching and non-matching templates across different conditions. Left panel: 1- “EC→EC”: ECnonCaf template predicting vigilance fluctuations of the ECnonCaf scans, 2- “EO→EC”: EOnonCaf template predicting vigilance fluctuations of the ECnonCaf scans, 3- “EO→EO”: EOnonCaf template predicting vigilance fluctuations of the EOnonCaf scans, and 4- “EC→EO”: ECnonCaf template predicting vigilance fluctuations of the EOnonCaf scans. Right panel: comparing the predictivity before and after caffeine. Each symbol represents a subject and different scanning sessions are shown with different colors.
