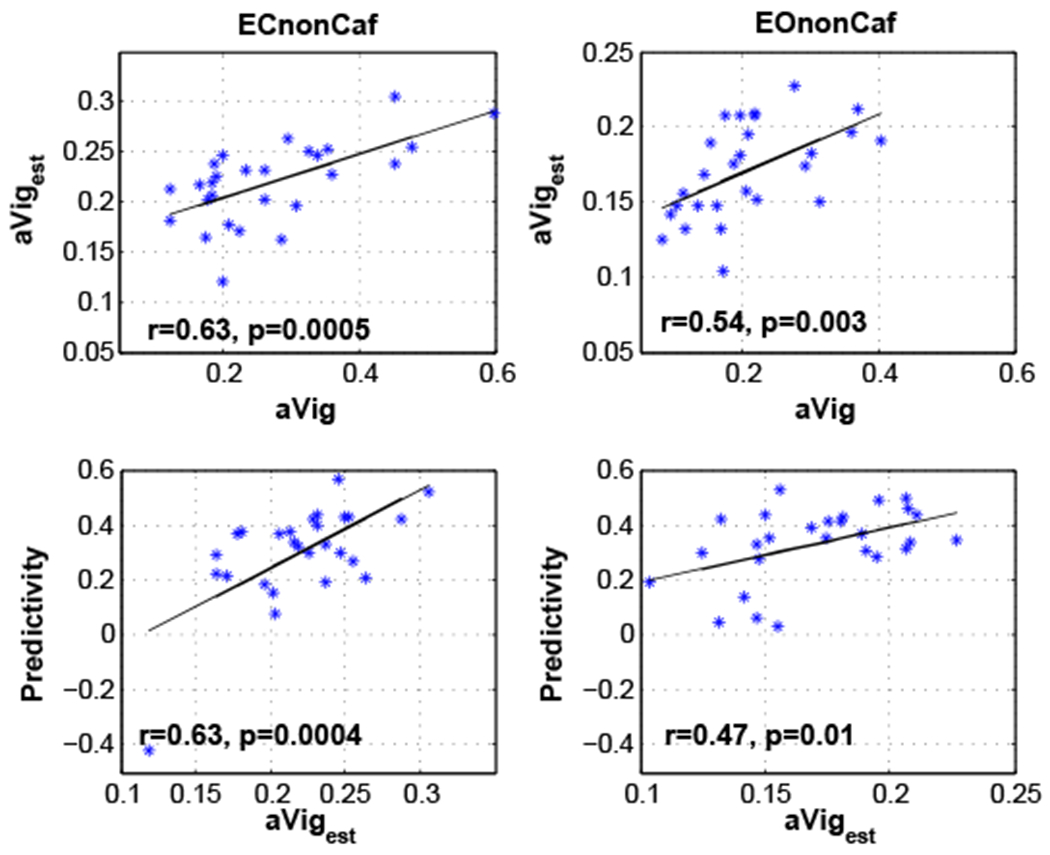
Figure 6:

Top row: Relation between the amplitude of the estimated vigilance time series (aVigest) and the amplitude of the EEG-based vigilance time series (aVig) with the linear fit shown by the black lines. Bottom row: Relation between predictivity and the amplitude of the estimated vigilance time series (aVigest) with the linear fit shown by the black lines.
