
Figure 7:
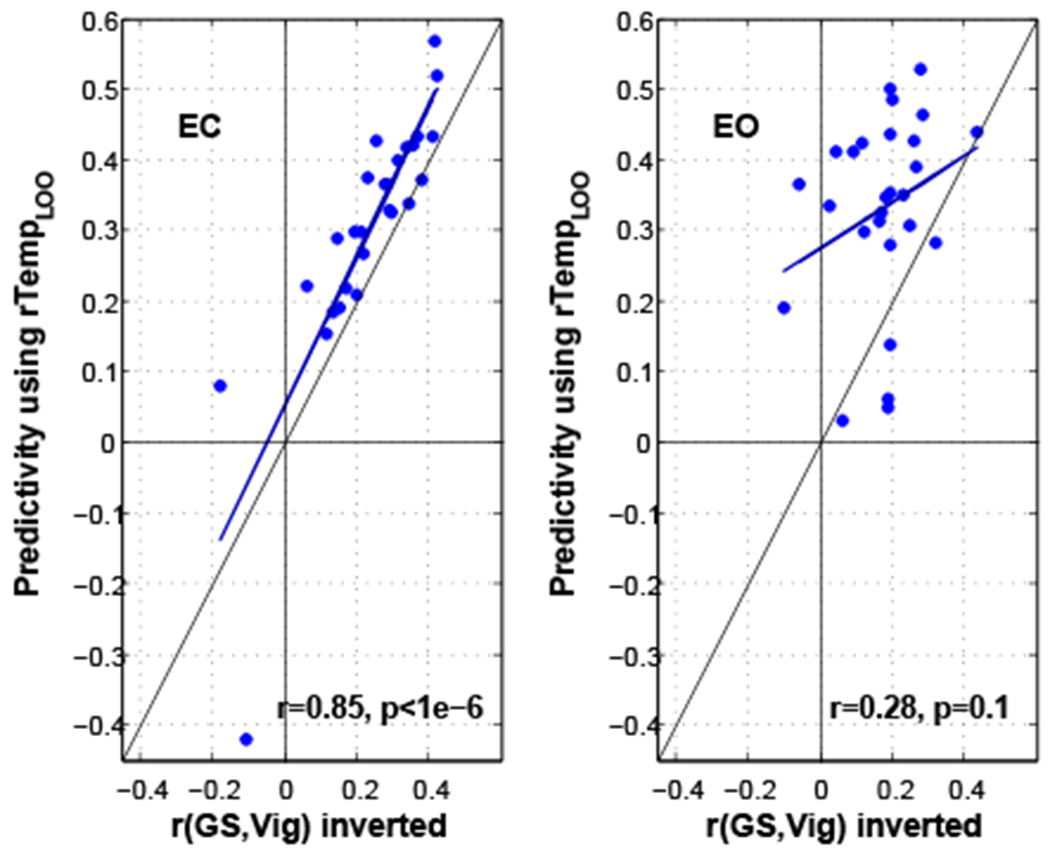
Predictivity using template versus the correlation between vigilance and global signal (inverted) for ECnonCaf and EOnonCaf conditions. The linear fits are shown by dark blue lines. The vertical, horizontal, and slanted black lines represent indicate the x-axis, y-axis, and line of unity, respectively.