. 2021 Jun 15;50(15):8400–8413. doi: 10.1039/d0cs00558d

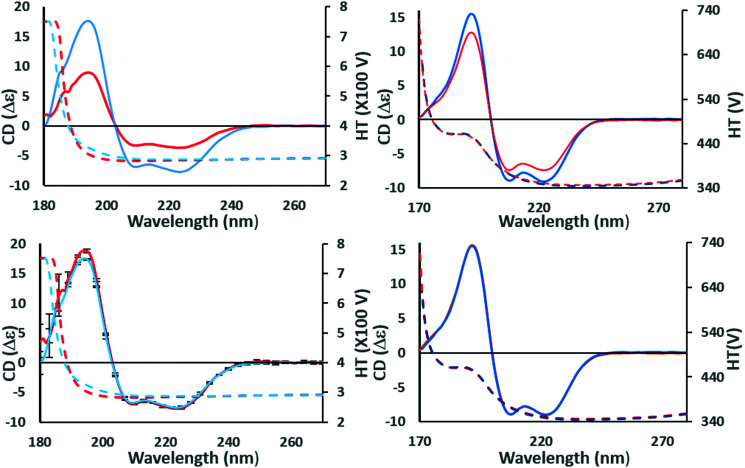
Fig. 2. Example of identifying the effects of scaling errors during data processing. These panels show the effects of scaling a spectrum at a single wavelength to check for similarities and correct for magnitude errors. (top left) The (incorrectly scaled) spectra of wild type (red) and a mutant (blue) construct of the NavMs voltage-gated-sodium channel (PDBID 5HDX). There are large differences in the magnitudes of the CD spectra (solid lines) although their shapes are similar. This could be due to a magnitude/scaling error resulting from the use of inaccurate concentration or pathlength values in the calculations, but it can be checked as follows: (bottom left) the CD spectra are scaled to the same CD value at the 222 nm peak, making it evident that there is a small but significant difference between their spectral shapes (and note the small vertical reproducibility bars at 5 nm intervals do not overlap at the peak ∼195 nm, although they do overlap at the high wavelength peaks). However, the protein structures are not the same, and the difference due to the mutation can be quantified. Since neither of the corresponding high tension (HT) spectra, which is a measure of sample absorbance (dotted lines, same panels, with scale on right hand side of the plot), have exceeded the (predetermined) instrument cutoff value of 5 at wavelengths below ∼190 nm, this also confirms there has been no distortion of the peak due to too high absorbance. (top right) Spectra of calmodulin (PDBID 1LIN) at different pH values. In this case there is also a significant difference in the magnitudes of the CD spectra; however, scaling to the same values at 222 nm (bottom right) indicates that, in this case, because the scaled spectra overlay at all wavelengths, the apparent difference was due solely to concentration or pathlength measurement errors.

Fig. 2